Komodor offers a straightforward web interface for your convenience to help you monitor the state of Kubernetes clusters. Having both paid and freemium plans, it boasts a range of handy tools for tracking and managing the status of the resources deployed in the cluster, in addition to notifying users in the event that something goes wrong. Let’s have a look at what K8s operators might expect from using Komodor.
About Komodor
Launched back in 2020, Komodor is a service deployed in a K8s cluster for managing resources running inside the cluster, monitoring their statuses, and customising alerts to notify the user of any critical incidents that occur. At the same time, it does not support creating any new resources or deploying any applications from scratch — all you can do is roll them back to a previous version.
There are three pricing plans available:
- Freemium was introduced this January. It is available to everyone and includes up to 50 Kubernetes nodes, 5 clusters, and 5 users;
- Business covers up to 100 nodes, 10 clusters, and 50 users;
- Enterprise is intended for large companies and is customised according to the customer’s needs.
The Komodor agent is compatible with Kubernetes v1.16+ on any operating system.
Installation
First, register on the project website to obtain an access key associated with your account.
There are several ways to install Komodor Agent. You can do so manually using a pre-made script, the Helm chart, or Kustomize.
The installation command is found in your personal account. It comes with the API key for your account already included. We will use Helm:
helm repo add komodorio https://helm-charts.komodor.io
helm repo update
helm upgrade --install k8s-watcher komodorio/k8s-watcher \
--set watcher.actions.basic=true \
--set watcher.actions.advanced=true \
--set watcher.actions.podExec=true --set apiKey=XXXYYYZZZ \
--set watcher.clusterName=default \
--set watcher.actions.podExec=true \
--set watcher.resources.secret=true
Once the agent is deployed in the cluster, a web interface with a dashboard becomes available in your personal account on the Komodor website.
User interface and features
Here’s a shot of the web interface home screen:
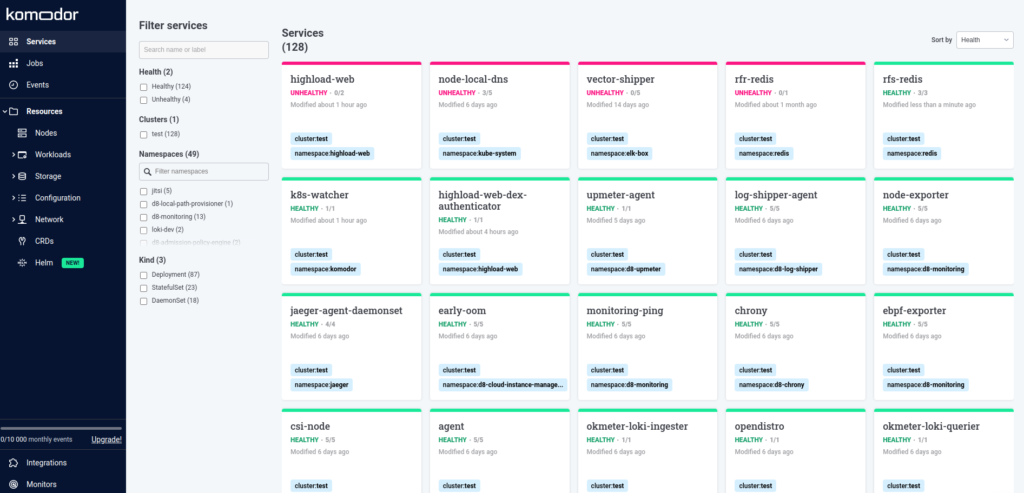
It is somewhat like the vanilla Kubernetes dashboard, yet featuring useful additions. The menu on the left has sections associated with the cluster components. Let’s take a look at them in closer detail.
Services: access all your K8s services instantly. You can filter them according to various criteria or click to view additional details about the service. It is equipped with the ability to edit, manage the status, as well as browse related events.
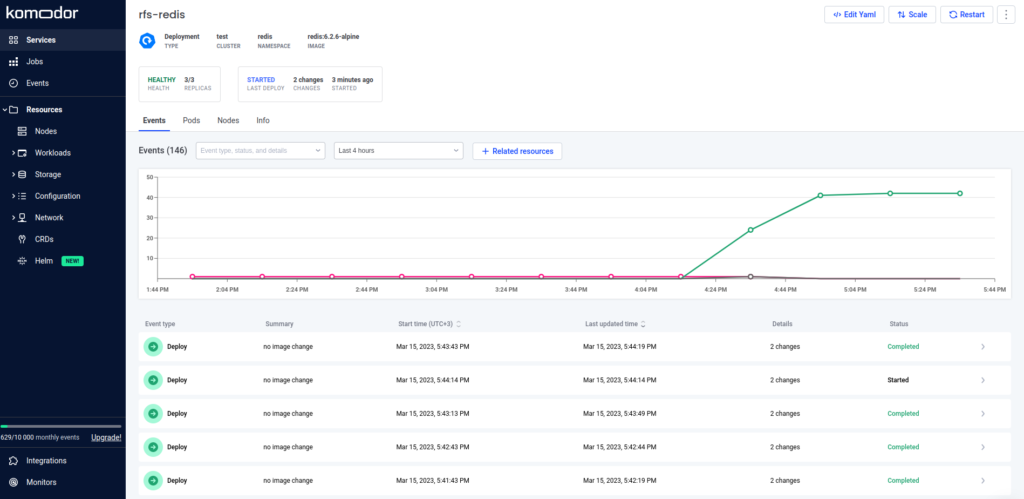
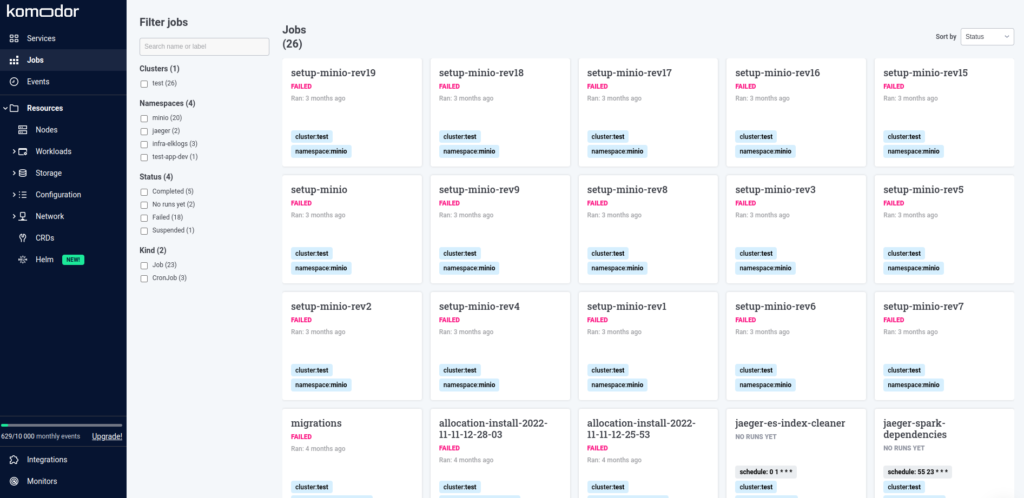
Jobs: browse completed and in-progress jobs.
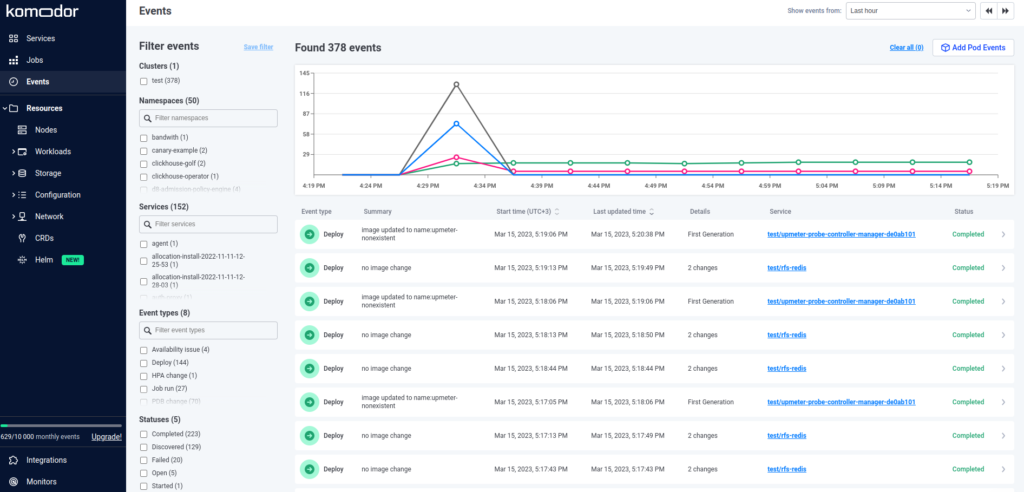
Events: browse the events in the cluster.
Resources: browse and manage cluster resources. The following resource types are supported:
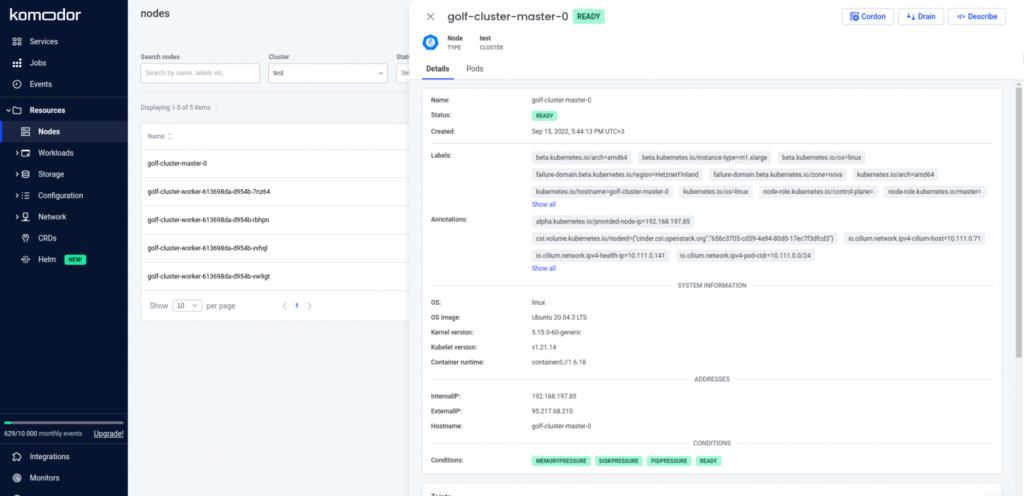
- Nodes: the user can drain or cordon the selected node, get it to rejoin the cluster, as well as browse its details and a list of all pods on the node.
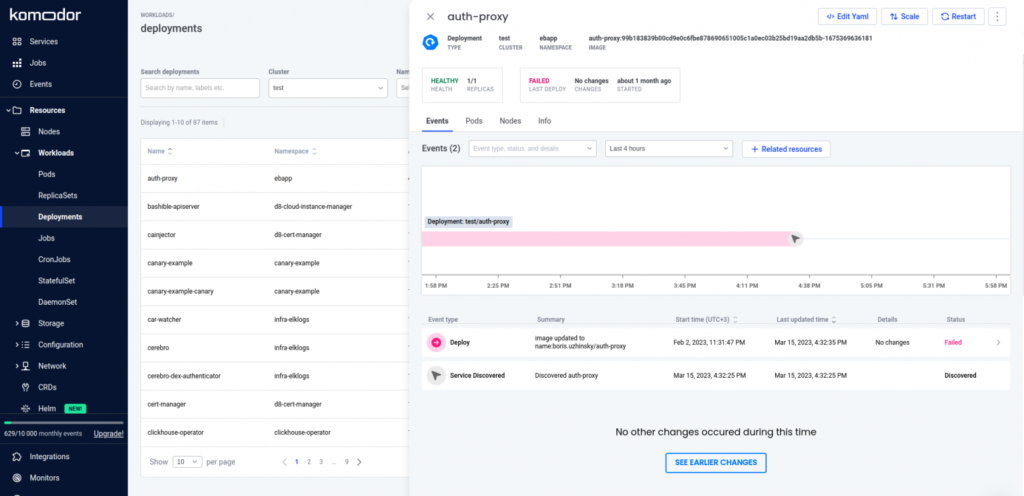
- Workloads: pods, ReplicaSets, Deployment, Job, CronJob, StatefulSets, and DaemonSets. Your options include being able to check the resource details, delete or modify it, change the number of replicas, and restart the resource (including Jobs and CronJobs).
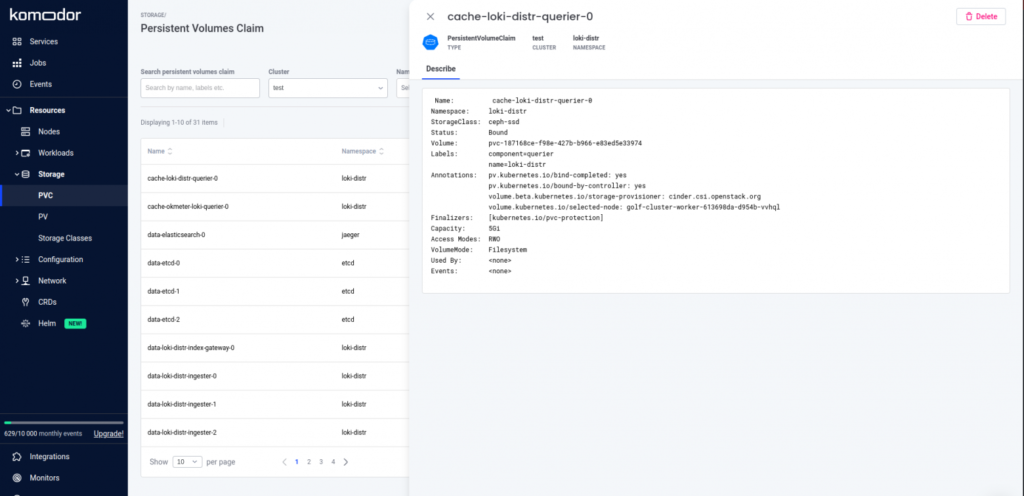
- Storage: includes PVC, PV, and StorageClass objects. You can check the object details or delete it. Editing is not supported.
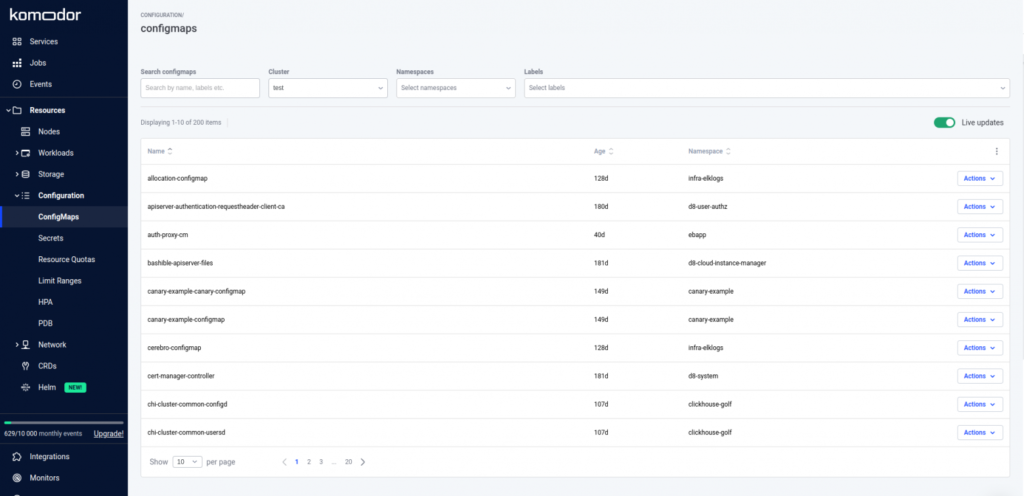
- Configuration: ConfigMaps, Secrets, Resource Quotas, Limit Ranges, HPA, and PDB. You can view the details of ConfigMaps and Secrets as well as edit and delete them. Meanwhile, for other resources, you can only view the details. Secrets are displayed Base64-encrypted.
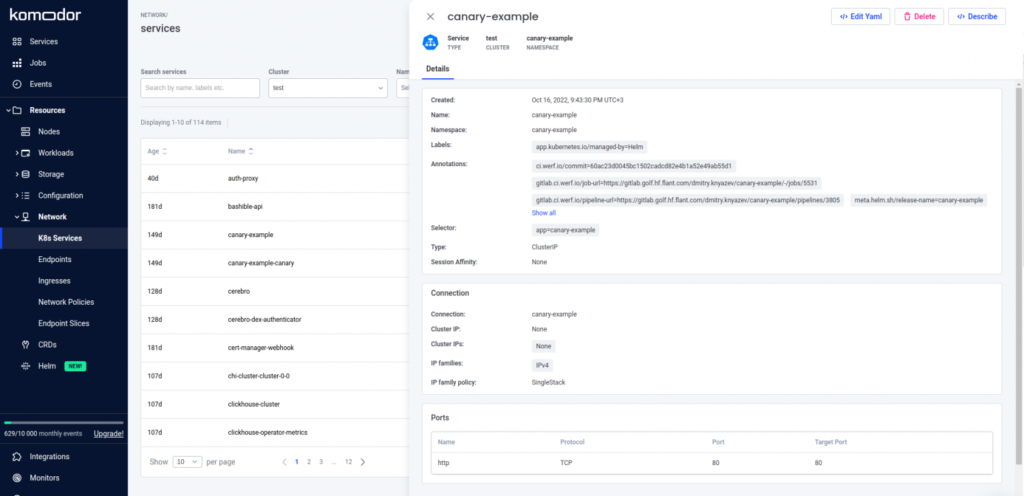
- Networks: K8s services, endpoints, ingresses, network policies, and endpoint slices. Services’ manifests can be deleted and edited, while Ingress can be deleted. For other resources, the only supported feature is viewing the details.
- Custom Resources Definition: this tab currently only lists CRDs that are in the cluster; you can’t view their details or edit them.
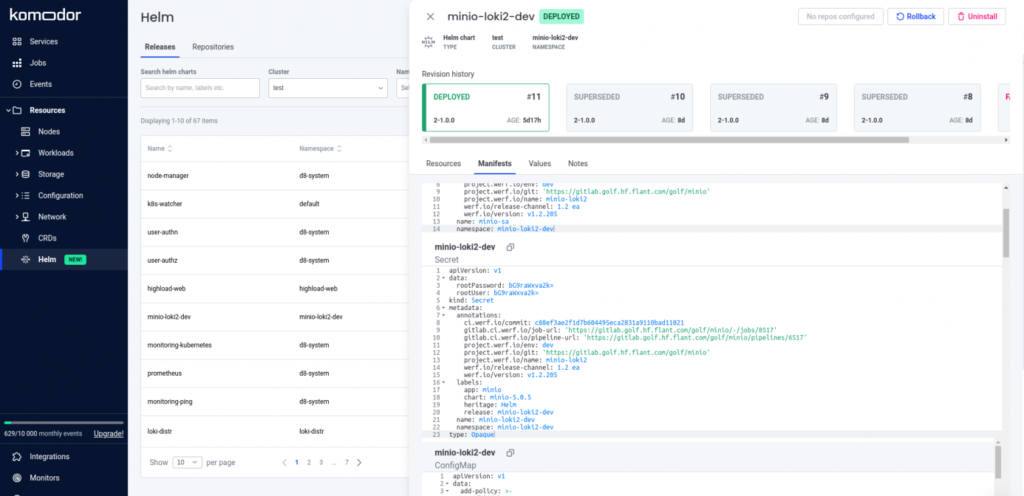
- Helm: Helm releases. You can browse release resources, switch to a resource by clicking on it, and view the manifests and as well as the values used for the release, comparing them with a particular version in addition to rolling back to a specific version and removing the release from the cluster.
We were only able to test the functionality with Helm 3 releases, as there were no Helm 2 releases in the demo cluster. The official documentation also doesn’t provide any details on Helm 2 support.
The remaining tabs link to the following resources:
- Integrations: managing integrations (see below for more details);
- Monitors: managing monitors to customize notifications;
- Settings: settings, profile, and access control.
Komodor: pros and cons
To sum it up, the main features of Komodor include:
- Easy navigation between services, jobs, and cluster events.
- Detailed information on the cluster nodes and their statuses, as well as the option to manage them.
- Managing key K8s objects, provided that the user has the appropriate permissions. You can filter them based on various criteria, such as cluster, namespace, state, or label.
- Browsing and editing ConfigMaps and Secrets.
- Browsing and managing storage-related resources (PV, PVC, SC): you can delete and view the manifests.
- Listing applications deployed in the cluster by their type and relationship to other resources and managing them.
- Browsing and managing endpoints, K8s services, and ingresses.
- Automatic checking of your Kubernetes cluster’s objects for following the best practices, such as pods having memory & CPU limits, liveness probes being in place, etc.
- Browsing the Helm releases in a cluster, with an option to compare different versions of them with each other.
- The option to exec into the pod and use the terminal right in your browser.
- Viewing logs and events. In the Follow mode, logs are shown in real-time.
The following Komodor features deserve a special mention:
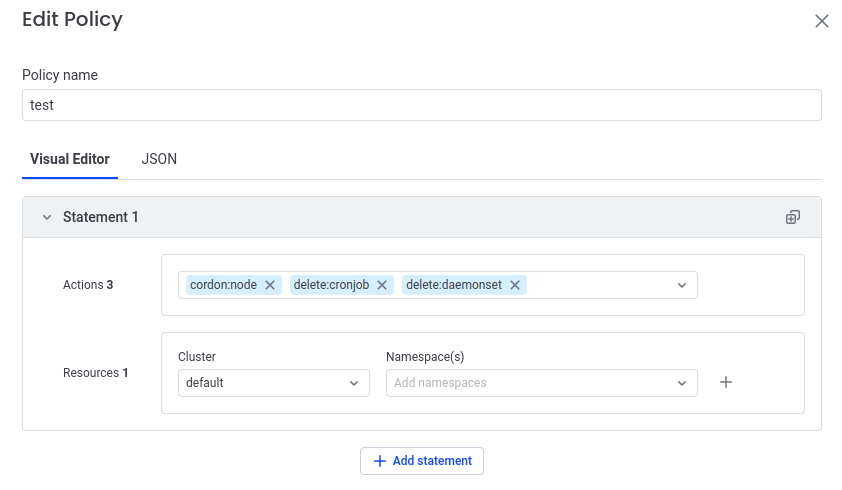
- Configuring resource access rights from the UI. You can create a custom policy, add it to a role, and then assign that role to your teammate. In doing so, you do not need to gain a prior grasp of the basics of Kubernetes RBAC. All you have to do is specify the access rights for the Watcher service in your Values while installing Komodor in the cluster.
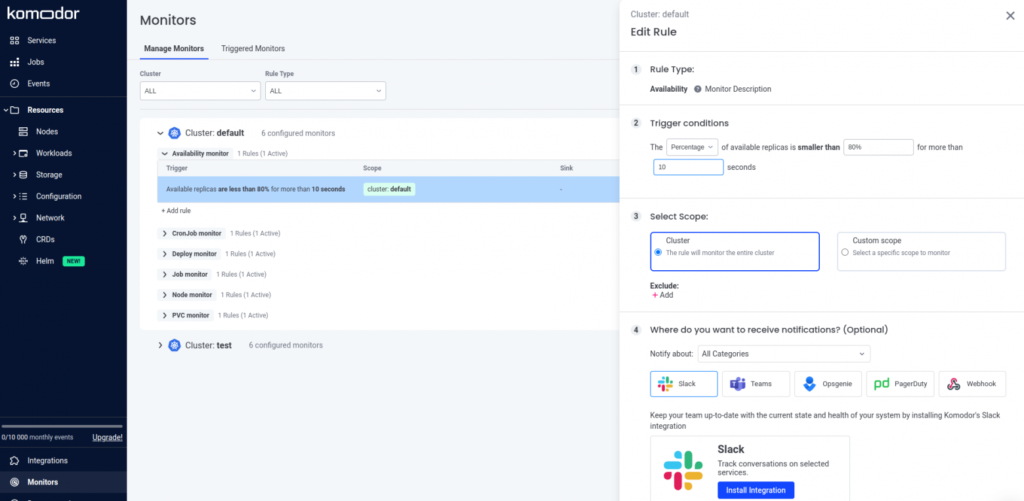
- No-hassle monitor configuration. The monitors track the status of cluster resources and send notifications to services like Slack, Teams, Opsgenie, PageDuty, or any other service that supports receiving webhooks.
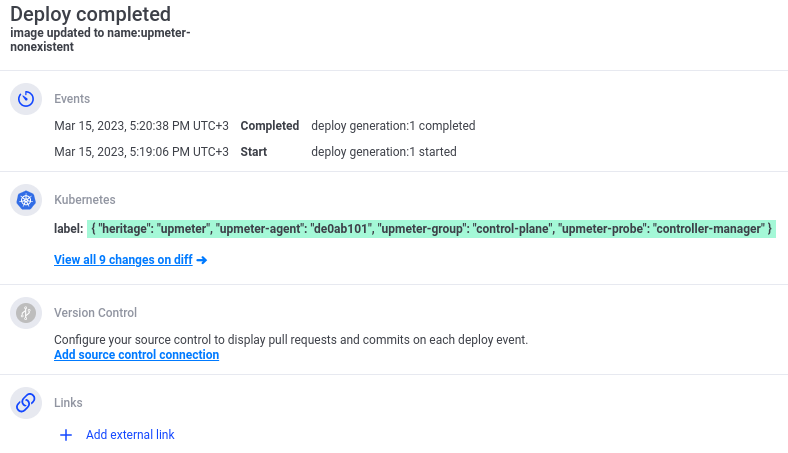
- Pre-configured checks — implemented as playbooks — to boost your troubleshooting process. E.g., if your Deployment’s pods are unhealthy, Komodor will automatically check your latest deploy changes so that you can see the possible reasons for the unhealthy state straight away. If you have an issue with your node, Komodor will try to investigate the reasons behind it on different levels, automating the regular actions you, as a Kubernetes operator, will most likely perform and accelerating the root cause analysis.
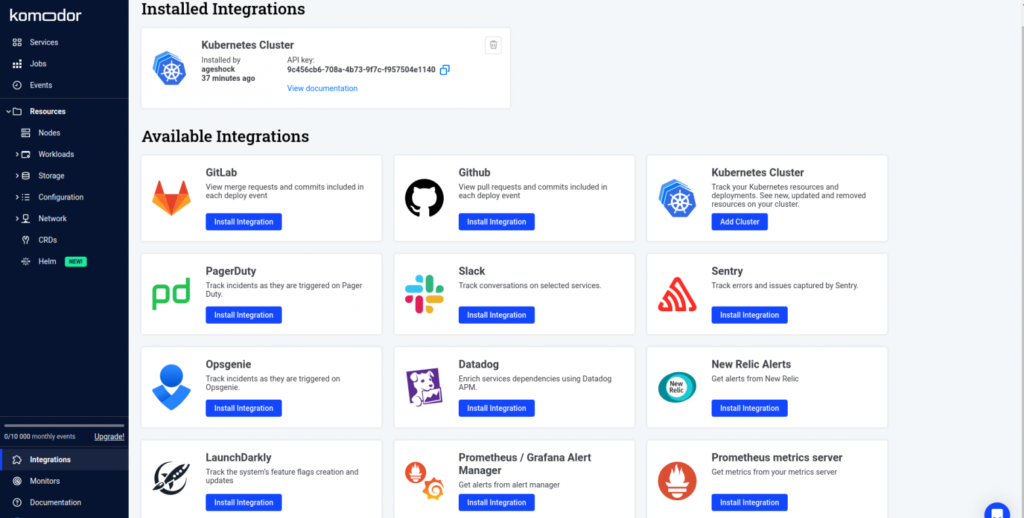
- The option to integrate Komodor with a variety of services:
- cloud-based GitLab and GitHub: you can view pull and merge requests based on which resources have been deployed to the cluster;
- Slack, Microsoft Teams, or other third-party messengers to send events and notifications;
- Sentry and NewRelic monitoring systems;
- Prometheus and Alertmanager: information regarding the resources nodes and pods in the cluster are consuming will also be shown here.
- The option to connect additional clusters and monitor their statuses from the existing Komodor interface. All you have to do is run a pre-made script to install Watcher in the cluster once it has been added to the integration. You will then be able to switch between clusters right in the interface.
Well, that all sounds cool! What are the cons we can mention regarding Komodor? Here they are:
- You can only browse the list of the cluster’s Custom Resources, with no details displayed.
- At the moment, documentation is pretty scarce, although the developers are working hard to add new sections and expand the old ones.
- You cannot connect self-hosted GitLab deployments: integration is only possible with cloud-based GitLab.
- After all, it is a commercial offer. The price is 30 USD for each integrated node. It’s up to you to decide whether it’s worth that.
- The service can only be used as SaaS — some of the software is installed in a cluster, while the interface itself is provided by the service and is not available for self-hosted installation.
Conclusion
In my opinion, Komodor provides a convenient web interface for managing and maintaining a Kubernetes cluster. I enjoyed its pleasant design, thought-out troubleshooting automation, and large selection of supported integrations. At the same time, the Business plan price seems rather high in my case. On top of that, there is a limit to the number of events that can be collected per month.
Despite these minor flaws, I think that for a small development team, Komodor can be a useful tool for monitoring clusters or sandboxing without having to rummage around the maze of the command line and kubectl.


Comments