This article overviews Kubernetes security fundamentals and provides five practical steps to bolster security and security rules you must adhere to when running K8s. Thanks to various practical hints and real-life cases, we hope it will be helpful for both beginners and more advanced Kubernetes administrators.
Security in Kubernetes: current state
Security is a hot topic in the IT community. Despite the fact that we even have the DevSecOps trend and all the related talks, it is still a priority area that’s nevertheless seldom handled right. As a result, we end up having to sort out the numerous consequences of poor security configurations.
But why has the issue of security in Kubernetes gained so much traction as of late? The answer is obvious — Kubernetes is no longer mere technological hype. Now, all sizes of businesses — large, small, and medium — use it as the industry standard. Various studies* now show: the Kubernetes adoption rate and number of K8s clusters are on a steady upward trajectory.
* For example, “Kubernetes in the wild report 2023” by Dynatrace demonstrates the +127% annual growth rate of Kubernetes clusters number in the cloud and +27% growth for on-premises K8s clusters. VMware’s “The State of Kubernetes 2022” stated that 29% of organizations had 50+ Kubernetes clusters in 2022 as opposed to 16% and 15% in 2021 and 2020, correspondingly. It also said that 48% of organizations expected substantial (50-100%) or dramatic (100%+) growth of their K8s cluster number.
At first glance, it seems the more clusters there are, the better — since Kubernetes is designed to address the issues we all face. It does indeed streamline operations, speed up delivery, boost the daily deployment rate, etc. What possibly could go wrong?
The first challenge anyone faces in adopting a new technology is a lack of expertise in that field:
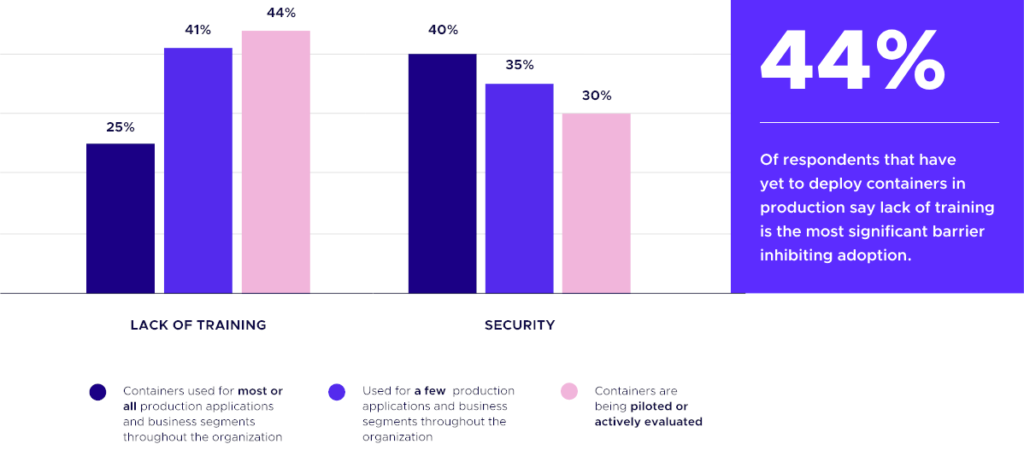
As companies build it up and move more and more workloads into the cluster, they start to focus on other issues. Security often emerges as a major challenge in organizations where containers are used for virtually all their applications.
As Red Hat’s “State of Kubernetes security report 2023″ shows, 90% of respondents experienced at least one security incident in the past 12 months. It also reveals that while Kubernetes aims to speed up application deployment, 67% of respondents ended up slowing down or delaying application deployment due to security issues in the cluster. Datadog’s 2022 container report found that the most popular Kubernetes version in use to that date was v1.21, which passed its end-of-life date earlier that year, meaning all those users were getting no security fixes.
So what should you do? How do you put an end to your worries and be able to start enjoying Kubernetes?..
Security standards overview
First of all, let’s see which security standards we have since they are created to accumulate the best practices and provide us guidance on how to configure Kubernetes properly.
One of the most prominent among them is the Kubernetes CIS Benchmark authored by the well-known Center for Internet Security, a nonprofit organization aimed at helping individuals, companies and governments to protect from cyber threats.
There are various tools leveraging the CIS benchmark to check your Kubernetes cluster, most notably kube-bench by Aqua Security (covered in our blog before) and Kubescape by ARMO. The latter got the CIS benchmark support last October and was accepted to the CNCF as a sandbox project two months later.
The benchmark contains specific instructions on how to render the K8s cluster secure — all the way down to what flags to set for the API server. Here’s what it (and the tools implementing it) checks in your Kubernetes setup:
- Control Plane components:
- Node configuration files;
- Control Plane;
- API server;
- Controller Manager;
- Scheduler;
- etcd;
- Control Plane configuration:
- Authentication and authorization;
- Logging and auditing;
- Worker Nodes:
- Worker Node config files;
- Kubelet configuration;
- Policies: RBAC, Service Accounts, Pod Security Standards, and Network Policies.
There is also a standard published by the PCI SSC (Payment Card Industry Security Standards Council) in September 2022. Find a PDF with its v1.0 here. The council unifies major payment system providers such as Visa and MasterCard. Its guidance differs from the CIS Benchmark in that it only contains recommendations on how to structure processes with respect to container orchestration tools in general. Thus it does not provide any Kubernetes-specific tips. The PCI council’s document covers the following sections:
- Authentication and authorization;
- Application security;
- Network security;
- Secret management;
- Monitoring & auditing;
- Runtime security;
- Resource management;
- Configuration management.
There are many other standards from both for-profit and non-profit organizations. They are complemented by all sorts of datasheets and checklists from companies developing Kubernetes security-related software.
The idea behind all the standards
These recommendations share one common idea described in the official Kubernetes documentation: security in K8s should be regarded on a layer-by-layer basis.
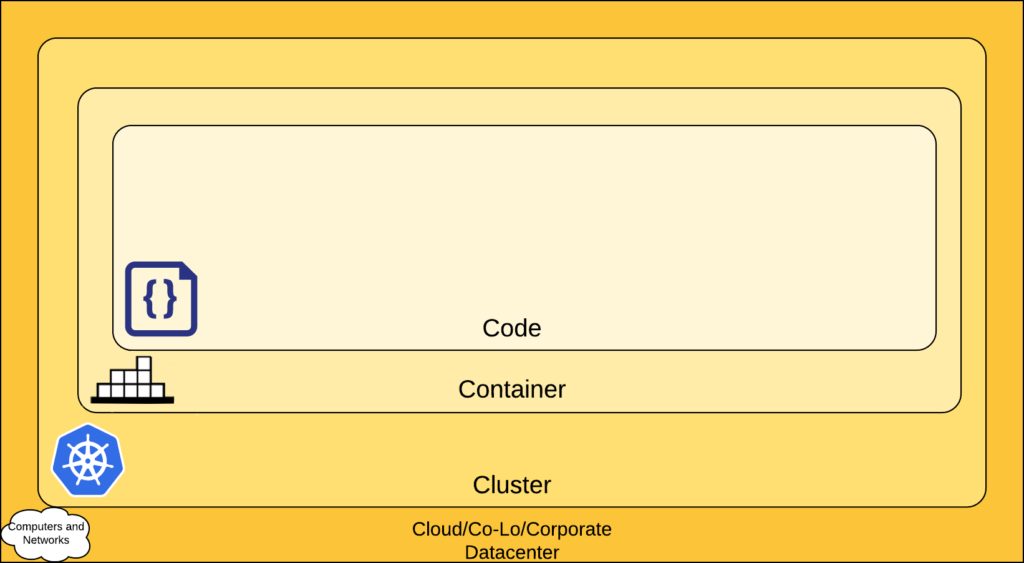
This security model is named 4C after the first letters of each layer: Code, Container, Cluster, and Cloud. It provides different security recommendations for each layer where you:
- Start with the Code layer to protect the applications and libraries you use;
- Perform container vulnerability scanning, control and protect the runtime;
- Restrict access to the Kubernetes control plane and cluster nodes;
- Set up secure access to the cloud’s APIs and infrastructure.
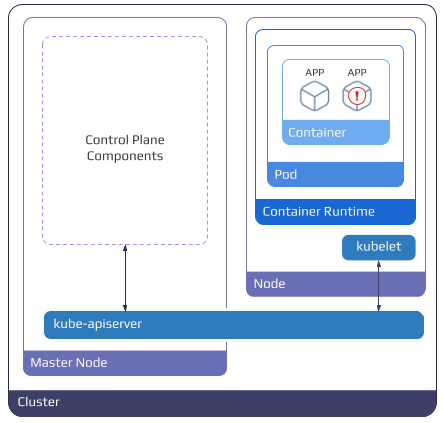
Needless to say, in the event that an attacker gains access to the cloud API, it no longer matters what the protection levels below are, i.e. how secure the code in the container is. The attacker will simply delete the virtual machines, manipulate the data on the disks, and so on.
In the following sections, we are going to talk about the Code, Container, and Cluster layers.
The five steps to Kubernetes security
We maintain Kubernetes clusters for various enterprise clients, so it’s common to communicate with their information security department and satisfy the requirements they lay out. Based on this experience as well as the abovementioned standards and specifications, we realized that the following 5 steps to security are sufficient to satisfy most (say, 90%) of security needs:
- Proper configuration of Kubernetes clusters;
- Image scanning;
- Network security;
- Controlling running applications;
- Auditing and event logging.
Let’s look at them in greater detail.
Step #1: Proper Kubernetes cluster configuration
- Start off by running the CIS benchmark and checking whether the node and control plane settings are in line with those that are outlined in the standard. Kube-bench and Kubescape are perfect for checking whether Kubernetes is deployed according to security best practices as defined in the CIS Kubernetes Benchmark. All you have to do is run one of them, examine the test results, and fix any issues reported in the warnings.
- If possible, you are well-advised to restrict network access to the Kubernetes API, set up white lists, enable VPN-only access, and so on.
- Each user that accesses the Kubernetes API has to be uniquely identified. This is essential for subsequent audits and understanding who did what; it also comes in handy for RBAC granulation.
- Each user must be granted only the RBACs they need. For example, suppose some operator in a cluster gets a list of all the pods. In this case, (s)he does not need to be allowed to see all the secrets, much less edit them.
This all seems simple enough. However, there’s a real live example to consider.
I deployed Kubernetes clusters with a couple of cloud providers and ran a CIS benchmark. There were practically no errors or warnings. The worker nodes were the only ones tested since not all providers offer access to the control plane nodes. I then looked at how access to my newly deployed cluster was implemented — after all, we always interact with a new cluster by gaining access to the Kubernetes API.
After downloading and examining kubeconfig, I discovered that the system:masters group was used. The first point of the Kubernetes security checklist, however, clearly states that once a cluster is deployed, no one should be authenticated in it as system:masters.
The certificate was issued for one month. If an attacker gains access to this kubeconfig, all CAs in the cluster will have to be re-issued because it is impossible to revoke access from the system:masters group without doing so.
As you can see, even cloud providers might break the most basic security rules, so you should always keep them in mind.
Step #2: Image scanning
Now it is time to think about what software we are going to run in the cluster and how to ensure that it is safe, at least at a basic level. The obvious solution is to scan the container images we use.
You can do so at different stages, i.e.:
- scan them at the CI/CD pipeline stage,
- set up a scheduled registry scan,
- scan all the images being used in the Kubernetes cluster.
There are many tools that allow you to do just that, including Open Source solutions, such as Trivy from Aqua Security and Grype from Anchore. It is up to you to decide whether you choose one of those self-hosted options or better rely on SaaS offerings for scanning your images.
Once the scan is complete, analyze its results:
- Be sure to look for critical problems and warnings, as well as investigate the vulnerabilities you have found. Judge the problem in a rational way: even if we have found a critical vulnerability, it does not mean that it is exploitable.
- Use the base images. If you have a golden image and find a CVE in it, you can start by simply replacing the container image and restarting your CI/CD pipeline.
- Avoid adding unnecessary dependencies to the images. For example, debugging tools of all kinds should never end up in production images.
- For compiled languages, you must build an artifact, compile a binary in it, copy it to the golden image, and then run the resulting golden image in production.
The higher the number of redundant dependencies there are, the higher the risk is of them having CVEs.
Step #3: Network security
Now that we’ve built the app and prepared it for use, it’s time to think about how to run it in our cool new Kubernetes cluster.
The first thing that comes to mind is that you have to ensure its security on the network level by following these best practices:
- The CNI in the cluster must support network policies;
- Ingress and egress policies must be configured for all cluster components;
- Set “deny all” as your default policy and explicitly allow all required connections.
Here is a related real-life case. A customer asks to audit their Kubernetes setup. All looks fine: K8s is up and running, certificates are used everywhere, and developers have access to the stage namespace only.
However, it is a multi-tenant cluster. It is a widespread pattern when several large clusters are deployed where stage and production coexist within the same control plane. Granted, developers are limited to the stage environment. However, in fact, they can get literally anywhere from there (e.g., reach production databases) since there is no network segmentation and isolation. What can be done about it?
Personally, we use Cilium (we explained our motivation before). It features a visual editor that allows you to set up a proper policy in just a few clicks. That policy will only allow the developer to work within its namespace and access Kubernetes DNS. Here is what the created egress policy might look like:
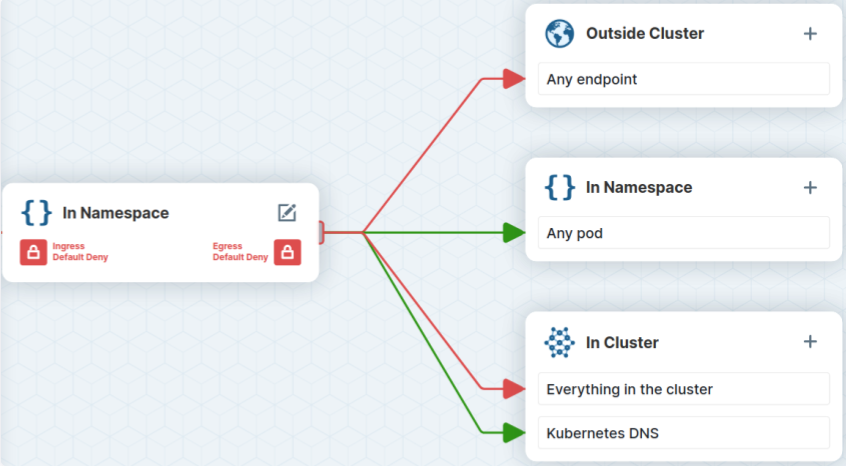
egress:
   - toEndpoints:
       - matchLabels:
           io.kubernetes.pod.namespace: kube-system
           k8s-app: kube-dns
     toPorts:
       - ports:
           - port: "53"
             protocol: UDP
         rules:
           dns:
             - matchPattern: "*"
   - toEndpoints:
       - {}
In this case, the developer can only access the database in the stage environment; no access to the production environment is permitted.
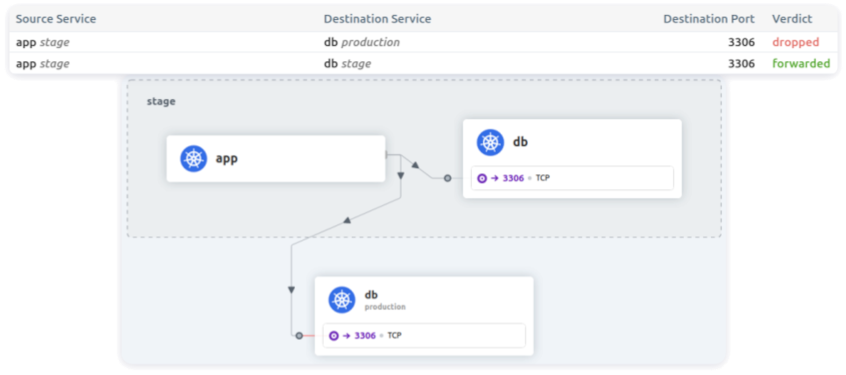
You might be surprised to hear another real-life story. We’ve seen instances where the passwords and names of the stage and production databases… were the same. If developers or engineers were not careful enough, their queries intended for the stage database could end up in the production one!
Ok, enough of bad practices — let’s better come back to other useful general rules:
- You shouldn’t assume that all things deployed in a private environment are secure by default. We have to keep track of these things and understand who is going where and what they do. The importance of this cannot be overstated.
- The policies-as-code approach is important as well. Being similar to the infrastructure-as-code (IaC) approach, it means that security policies are stored in the Git repository and deployed along with the app.
- Finally, you have to introduce all these things right at the start since it is much easier to instil relevant practices at that point than at any other. When introducing a new component, its network interactions must be immediately outlined, and policies must be put in place. It takes much more effort to introduce policies into an infrastructure that’s already running.
Step #4: Control of running applications
Now that we’ve covered network security, there is also the concept of runtime to discuss — the host to run containers on.
In Kubernetes, requests pass through a rather long chain. One of its features is the Admission Controller, which validates the objects created in the cluster. Kubernetes 1.23 features Pod Security Admission, which covers basic security needs.
Included along with that are Pod Security Standards, which, among other things, prohibit running pods as root, using the host network, and so on. In the event that these policies are not enough, you can leverage the following Open Source options:
When Pod Security Standards are not enough? Our investigation into such cases resulted in the creation of an OperationPolicy CRD for our Kubernetes platform. It works on top of the Gatekeeper resources. Here’s how its configuration looks:
apiVersion: deckhouse.io/v1alpha1
kind: OperationPolicy
metadata:
  name: common
spec:
  policies:
    allowedRepos:
      - myregistry.example.com
    requiredResources:
      limits:
        - memory
      requests:
        - cpu
        - memory
    disallowedImageTags:
      - latest
    requiredProbes:
      - livenessProbe
      - readinessProbe
    maxRevisionHistoryLimit: 3
    imagePullPolicy: Always
    priorityClassNames:
    - production-high
    checkHostNetworkDNSPolicy: true
    checkContainerDuplicates: true
  match:
    namespaceSelector:
      labelSelector:
        matchLabels:
         operation-policy.deckhouse.io/enabled: "true"
This is something we would also recommend to leverage from the very start. It enforces well-known best practices, such as:
- Only trusted registries are allowed. Developers are not allowed to use Docker Hub images for certain namespaces;
- The pod resources (requests, limits) must be specified;
- Probes must be specified;
- The revision history limit is enforced;
- priorityClasses usage is required. I have seen a great number of cases in which, for example, the logging system had a higher priority level than the backend. In the end, the system didn’t work as expected;
- The latest tag is forbidden.
Ok, so what kind of things is the Admission Controller designed to address in general? The most striking example is a rather old but still relevant CVE-2019-5736 (right, it’s from 2019!): running a container as root allows an attacker to access the host system. The risks of succumbing to this vulnerability increase manifold if developers are allowed to run images from untrusted (public) sources.
At the end of this section, I would like to emphasize that defining application security policies is a must. More control means a lower likelihood of an error occurring and, therefore, less of a chance of having a vulnerability exposed.
Step #5: Auditing and logging events
Now that the application is up and running, you will want to see what is going on in Kubernetes and the system as a whole. But wait: this is not about monitoring and scraping metrics from pods. This is about auditing events.
Kubernetes has built-in neat auditing out-of-the-box — Kubernetes API auditing, which is very easy to set up. Logs are either written to a file or stdout. At that point, they are collected and fed back to the logging system for further analysis.
Below is an example of a basic policy for collecting requests that are sent to pods:
apiVersion: audit.k8s.io/v1
kind: Policy
omitStages:
 - RequestReceived
rules:
 - level: RequestResponse
   resources:
   - group: ""
     resources: ["pods"]
Applying this policy will result in a log that looks like this:
{
 "kind": "Event",
 "apiVersion": "audit.k8s.io/v1",
 "level": "RequestResponse",
 "auditID": "28eff2fc-2e81-41c1-980b-35d446480e77",
 "stage": "ResponseComplete",
 "requestURI": "/api/v1/namespaces/default/pods/nginx-6799fc88d8-5p7x5",
 "verb": "delete",
 "user": {
   "username": "system:serviceaccount:d8-service-accounts:gitlab-runner-deploy",
   "uid": "fd5a6209-c893-4b77-adf7-90500ecd2723",
   "groups": [
     "system:serviceaccounts",
     "system:serviceaccounts:d8-service-accounts",
     "system:authenticated"
   ]
 },
...
In the above snippet, you can see that the service account has deleted the NGINX pod.
But is that information complete? Not really.
It’s not enough to merely collect such events; you have to analyze them as well. Suppose a service account deleted some pod or created a resource in production. In that case, it is probably a legitimate operation and part of the deployment process. However, if an ordinary user was able to change or create something that was in production, that would be a totally different situation. It would be nice to be notified of this user’s actions, as well as to learn that there is some suspicious activity going on in the cluster.
It is also necessary to log events in the host OS and in the runtime environment. For instance, the crictl exec command may not be captured by the Kubernetes API audit, and we may not know that someone has logged into a pod (which is something we’d like to know about). On top of that, we would like to know what processes are running inside the containers.
Applications that implement runtime security help when it comes to such challenges. Luckily, we have handy tools to address this, too. For example, you can leverage Falco, a CNCF incubating project, originally created by Sysdig. That’s what we actually do in our K8s platform, and thus, I’ll use it as a real-life illustration of how you can get a practical solution here.
What the Falco-based component does is the following:
- parses system calls on the host;
- retrieves the audit log from the Kubernetes API via the webhook backend;
- checks the event stream using configured rules;
- sends alerts if rules are breached.
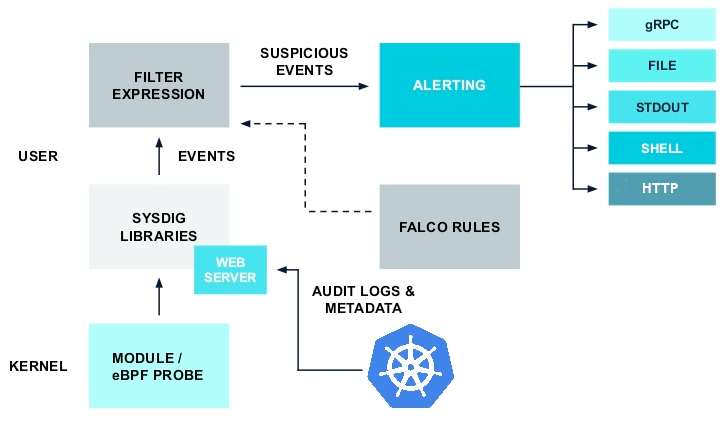
As you can see in this picture, we have three major ingredients:
- a kernel powered by eBPF technology that collects system calls,
- a webhook that collects events from the Kubernetes API,
- Falco with the rules.
Falco validates incoming events against these rules, and if something is fishy, it passes the data on to the alerts system.
Falco is deployed as a DaemonSet to all cluster nodes:
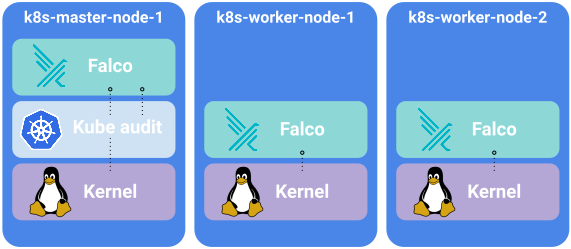
The pod with Falco contains:
- An init container to run the eBPF program;
- Falco to collect events and augment them with metadata;
- shell-operator to compile the Falco audit rules and prepare the Falco rules;
- falcosidekick to serve the metrics;
- kube-rbac-proxy to restrict access to the metrics.
Falco audit rules are also implemented as the Custom Resource, enabling validation against the OpenAPI specification and making our life more convenient:
apiVersion: deckhouse.io/v1alpha1
kind: FalcoAuditRules
metadata:
 name: host-audit-custom
spec:
 rules:
 - list:
     name: cli_proc_names
     items: [crictl, docker]
 - macro:
     name: spawned_process
     condition: (evt.type in (execve, execveat) and evt.dir=<)
 - rule:
     name: Crictl or docker cli are executed
     desc: Detect ctl or docker are executed in cluster
     condition: spawned_process and proc.name in (crictl, docker)
     output: Crictl or docker are executed (user=%user.name user_loginuid=%user.loginuid command=%proc.cmdline pid=%proc.pid parent_process=%proc.pname)
     priority: Warning
     tags: [host]
The created Falco audit rules are converted to regular Falco rules on the fly:
- items:
 - crictl
 - docker
 list: cli_proc_names
- condition: (evt.type in (execve, execveat) and evt.dir=<)
 macro: spawned_process
- condition: spawned_process and proc.name in (cli_proc_names)
 desc: Detect crictl or docker are executed in cluster
 enabled: true
 output: Crictl or docker are executed (user=%user.name user_loginuid=%user.loginuid
   command=%proc.cmdline pid=%proc.pid parent_process=%proc.pname)
 priority: Warning
 rule: Crictl or docker cli are executed
 source: syscall
 tags:
 - host
Falco rules contain lists and macros that allow you to reuse code snippets and compose clearer and more concise conditions.
If you apply the above-provided rule, you will see the following output in the logs:
{
  "hostname": "demo-master-0",
  "output": "14:17:03.188306224: Warning Crictl or docker are executed (user=<NA> user_loginuid=1000 command=crictl ps pid=273049 parent_process=bash) k8s.ns=<NA> k8s.pod=<NA> container=host",
  "priority": "Warning",
  "rule": "Crictl or docker cli are executed",
  "source": "syscall",
  "tags": [
    "host"
  ],
  "time": "2023-03-14T14:17:03.188306224Z",
  "output_fields": {
    "container.id": "host",
    "evt.time": 1678803423188306200,
    "k8s.ns.name": null,
    "k8s.pod.name": null,
    "proc.cmdline": "crictl ps",
    "proc.pid": 273049,
    "proc.pname": "bash",
    "user.loginuid": 1000,
    "user.name": "<NA>"
  }
}
{
  "hostname": "demo-master-0",
  "output": "14:43:34.760338878: Warning Crictl or docker are executed (user=<NA> user_loginuid=1000 command=crictl stop 067bd732737af pid=307453 parent_process=bash) k8s.ns=<NA> k8s.pod=<NA> container=host",
  "priority": "Warning",
  "rule": "Crictl or docker cli are executed",
  "source": "syscall",
  "tags": [
    "host"
  ],
  "time": "2023-03-14T14:43:34.760338878Z",
  "output_fields": {
    "container.id": "host",
    "evt.time": 1678805014760339000,
    "k8s.ns.name": null,
    "k8s.pod.name": null,
    "proc.cmdline": "crictl stop 067bd732737af",
    "proc.pid": 307453,
    "proc.pname": "bash",
    "user.loginuid": 1000,
    "user.name": "<NA>"
  }
}
The user with UID 1000 ran the crictl ps or crictl stop command.
The Kubernetes audit rules look more or less the same:
- required_plugin_versions:
   - name: k8saudit
     version: 0.1.0
- macro: kevt_started
 condition: (jevt.value[/stage]=ResponseStarted)
- macro: pod_subresource
 condition: ka.target.resource=pods and ka.target.subresource exists
- macro: kcreate
  condition: ka.verb=create
- rule: Attach/Exec Pod
 desc: >
   Detect any attempt to attach/exec to a pod
 condition: kevt_started and pod_subresource and kcreate and ka.target.subresource in (exec,attach)
 output: Attach/Exec to pod (user=%ka.user.name pod=%ka.target.name resource=%ka.target.resource ns=%ka.target.namespace action=%ka.target.subresource command=%ka.uri.param[command])
 priority: NOTICE
 source: k8s_audit
 tags: [k8s]
They also have macros and lists and do all the things Falco does. For example, the rule below would appear in the logs as a warning that someone has attempted to exec to a pod via the Kubernetes API:
{
  "hostname": "demo-master-0",
  "output": "18:27:29.160641000: Notice Attach/Exec to pod (user=admin@example.com pod=deckhouse-77f868d554-8zpt4 resource=pods ns=d8-system action=exec command=mkdir)",
  "priority": "Notice",
  "rule": "Attach/Exec Pod",
  "source": "k8s_audit",
  "tags": [
    "k8s"
  ],
  "time": "2023-03-14T18:27:29.160641000Z",
  "output_fields": {
    "evt.time": 1678818449160641000,
    "ka.target.name": "deckhouse-77f868d554-8zpt4",
    "ka.target.namespace": "d8-system",
    "ka.target.resource": "pods",
    "ka.target.subresource": "exec",
    "ka.uri.param[command]": "mkdir",
    "ka.user.name": "admin@example.com"
  }
}
However, it’s not enough to merely generate metrics. The cluster administrator has to be notified if there is any suspicious activity going on in the cluster. Since all metrics are sent to Prometheus, you need to create a rule for them:
apiVersion: deckhouse.io/v1
kind: CustomPrometheusRules
metadata:
 name: runtime-audit-pod-exec
spec:
 groups:
 - name: runtime-audit-pod-exec
   rules:
   - alert: RuntimeAuditPodExecAlerts
     annotations:
       description: |
         There are suspicious attach/exec operations.
         Check your events journal for more details.
       summary: Falco detected a security incident
     expr: |
       sum(rate(falco_events{rule="Attach/Exec Pod"}[5m])) > 0
Those can be configured either for specific Falco events or for events of a certain criticality level.
The greatest value in Falco is derived from the Falco rules. Given their highly customizable nature, you have to adjust them to specific applications and specific infrastructures. Here you can find an extensive list of Falco rules that can become a good starting point (there is a similar sample for Kubernetes audit rules as well). This Sysdig instruction on how you can mitigate CVE-2022-0492 is another vivid example of applying Falco rules.
Still not convinced enough? I often hear that auditing and logging might be needed for enterprise-level companies to pass certifications and nothing else. However, I doubt that. Falco is extremely helpful for addressing real incidents, including non-security ones. For example, you can use it to find a faulty operator in a cluster that’s illegitimately deleted some pods.
Finally, one of the most important components of auditing and logging is responding to threats. The administrator must be immediately notified when something occurs in the cluster that demands attention.
Conclusion
Ensuring security is an iterative process. There’s always room for improvement since there are many other essential security points in Kubernetes for its administrators (and not just DevSecOps engineers!) to consider:
- Authentication and authorization;
- RBAC auditing;
- Secret management;
- Supply chain security:
- Preventing images with vulnerabilities from running;
- Running signed images only and using cosign;
- Automated policy creation leveraging the learning mode;
- Automatic responses to audit events;
- …
Kubernetes itself is a large system that requires installing additional components to improve security. Meanwhile, the most important thing is to devote the necessary time and effort to establish that security. All too often, businesses want to deploy Kubernetes and move applications to K8s as quickly as possible, leaving no time for security. If that is the case, you need to introduce at least some of the solutions described above to address essential issues. Luckily, there are many tools for securing the cluster, including Open Source ones.
If you have no time at all to dedicate, it is a good option to consider off-the-shelf solutions. Alternatively, you may want to look at ready-to-use K8s platforms equipped well enough to address a multitude of security issues on their own.


Comments