Kubectl is the most important Kubernetes command-line tool that allows you to run commands against clusters. Internally, we share our knowledge of using it via formal wiki-like instructions as well as Slack messages (we also have a handy and smart search engine in place — but that’s a whole different story…). Over the years, we have accumulated a large number of various kubectl tips and tricks. Now, we’ve decided to share some of our cheat sheets with a wider community.
I am sure our readers might be familiar with many of them. But still, I hope you will learn something new and, thereby, improve your productivity.
NB: While some of the commands & techniques listed below were compiled by our engineers, others were found on the Web. In the latter case, we checked them thoroughly and found them useful.
Well, let’s get started!
Getting lists of pods and nodes
1. I guess you are all aware of how to get a list of pods across all Kubernetes namespaces using the --all-namespaces flag. Many people are so used to it that they have not noticed the emergence of its shorter version, -A (it exists since at least Kubernetes 1.15).
2. How do you find all non-running pods (i.e., with a state other than Running)?
kubectl get pods -A --field-selector=status.phase!=Running | grep -v Complete
By the way, examining the --field-selector flag more closely (see the relevant documentation) might be a good general recommendation.
3. Here is how you can get the list of nodes and their memory size:
kubectl get no -o json | \
  jq -r '.items | sort_by(.status.capacity.memory)[]|[.metadata.name,.status.capacity.memory]| @tsv'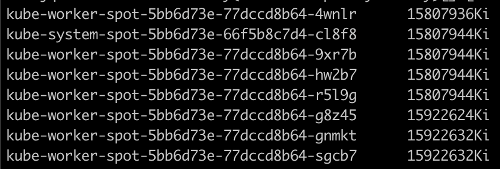
4. Getting the list of nodes and the number of pods running on them:
kubectl get po -o json --all-namespaces | \
  jq '.items | group_by(.spec.nodeName) | map({"nodeName": .[0].spec.nodeName, "count": length}) | sort_by(.count)'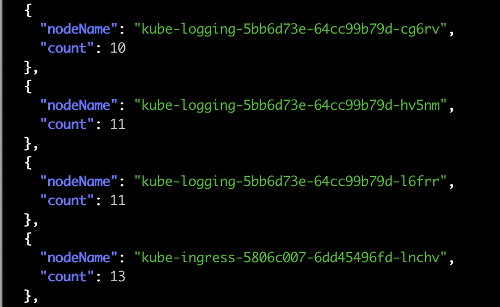
5. Sometimes, DaemonSet does not schedule a pod on a node for whatever reason. Manually searching for them is a tedious task, so here is a mini-script to get a list of such nodes:
ns=my-namespace
pod_template=my-pod
kubectl get node | grep -v \"$(kubectl -n ${ns} get pod --all-namespaces -o wide | fgrep ${pod_template} | awk '{print $8}' | xargs -n 1 echo -n "\|" | sed 's/[[:space:]]*//g')\"
6. This is how you can use kubectl top to get a list of pods that eat up CPU and memory resources:
# cpu
kubectl top pods -A | sort --reverse --key 3 --numeric
# memory
kubectl top pods -A | sort --reverse --key 4 --numeric
7. Sorting the list of pods (in this case, by the number of restarts):
kubectl get pods --sort-by=.status.containerStatuses[0].restartCount
Of course, you can sort them by other fields, too (see PodStatus and ContainerStatus for details).
Getting other data
1. When tuning the Ingress resource, we inevitably go down to the service itself and then search for pods based on its selector. I used to look for this selector in the service manifest, but later switched to the -o wide flag:
kubectl -n jaeger get svc -o wide
NAME                            TYPE        CLUSTER-IP        EXTERNAL-IP   PORT(S)                                  AGE   SELECTORjaeger-cassandra                ClusterIP   None              <none>        9042/TCP                                 77d   app=cassandracluster,cassandracluster=jaeger-cassandra,cluster=jaeger-cassandra
As you can see, in this case, we get the selector used by our service to find the appropriate pods.
2. Here is how you can easily print limits and requests of each pod:
kubectl get pods -n my-namespace -o=custom-columns='NAME:spec.containers[*].name,MEMREQ:spec.containers[*].resources.requests.memory,MEMLIM:spec.containers[*].resources.limits.memory,CPUREQ:spec.containers[*].resources.requests.cpu,CPULIM:spec.containers[*].resources.limits.cpu'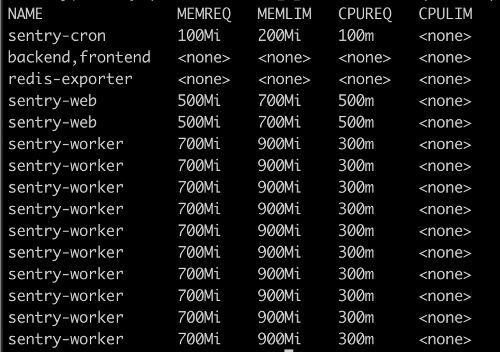
3. The kubectl run command (as well as create, apply, patch) has a great feature that allows you to see the expected changes without actually applying them — the --dry-run flag. When it is used with -o yaml, this command outputs the manifest of the required object. For example:
kubectl run test --image=grafana/grafana --dry-run -o yaml

apiVersion: apps/v1
kind: Deployment
metadata:
  creationTimestamp: null
  labels:
    run: test
  name: test
spec:
  replicas: 1
  selector:
    matchLabels:
      run: test
  strategy: {}
  template:
    metadata:
      creationTimestamp: null
      labels:
        run: test
    spec:
      containers:
      - image: grafana/grafana
        name: test
        resources: {}
status: {}
All you have to do now is to save it to a file, delete a couple of system/unnecessary fields, et voila.
NB: Please note that the kubectl run behavior has been changed in Kubernetes v1.18 (now, it generates Pods instead of Deployments). You can find a great summary on this issue here.
4. Getting a description of the manifest of a given resource:
kubectl explain hpa

KIND:     HorizontalPodAutoscaler
VERSION:  autoscaling/v1

DESCRIPTION:
     configuration of a horizontal pod autoscaler.

FIELDS:
   apiVersion    <string>
     APIVersion defines the versioned schema of this representation of an
     object. Servers should convert recognized schemas to the latest internal
     value, and may reject unrecognized values. More info:
     https://git.k8s.io/community/contributors/devel/api-conventions.md#resources

kind    <string>
     Kind is a string value representing the REST resource this object
     represents. Servers may infer this from the endpoint the client submits
     requests to. Cannot be updated. In CamelCase. More info:
     https://git.k8s.io/community/contributors/devel/api-conventions.md#types-kinds

metadata    <Object>
     Standard object metadata. More info:
     https://git.k8s.io/community/contributors/devel/api-conventions.md#metadata

spec    <Object>
     behaviour of autoscaler. More info:
     https://git.k8s.io/community/contributors/devel/api-conventions.md#spec-and-status.

status    <Object>
     current information about the autoscaler.
Well, that is a piece of extensive and very helpful information, I must say.
Networking
1. Here is how you can get internal IP addresses of cluster nodes:
kubectl get nodes -o json | \
  jq -r '.items[].status.addresses[]? | select (.type == "InternalIP") | .address' | \
  paste -sd "\n" -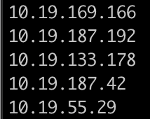
2. And this way, you can print all services and their respective nodePorts:
kubectl get --all-namespaces svc -o json | \
  jq -r '.items[] | [.metadata.name,([.spec.ports[].nodePort | tostring ] | join("|"))]| @tsv'
3. In situations where there are problems with the CNI (for example, with Flannel), you have to check the routes to identify the problem pod. Pod subnets that are used in the cluster can be very helpful in this task:
kubectl get nodes -o jsonpath='{.items[*].spec.podCIDR}' | tr " " "\n"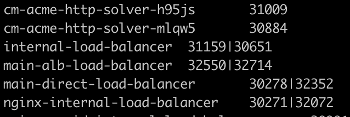
Logs
1. Print logs with a human-readable timestamp (if it is not set):
kubectl -n my-namespace logs -f my-pod --timestamps

2020-07-08T14:01:59.581788788Z fail:
Microsoft.EntityFrameworkCore.Query[10100]
Logs look so much better now, don’t they?
2. You do not have to wait until the entire log of the pod’s container is printed out — just use --tail:
kubectl -n my-namespace logs -f my-pod --tail=503. Here is how you can print all the logs from all containers of a pod:
kubectl -n my-namespace logs -f my-pod --all-containers4. Getting logs from all pods using a label to filter:
kubectl -n my-namespace logs -f -l app=nginx5. Getting logs of the “previous” container (for example, if it has crashed):
kubectl -n my-namespace logs my-pod --previousOther quick actions
1. Here is how you can quickly copy secrets from one namespace to another:
kubectl get secrets -o json --namespace namespace-old | \
  jq '.items[].metadata.namespace = "namespace-new"' | \
  kubectl create-f  -
2. Run these two commands to create a self-signed certificate for testing:
openssl req -x509 -nodes -days 365 -newkey rsa:2048 -keyout tls.key -out tls.crt -subj "/CN=grafana.mysite.ru/O=MyOrganization"
kubectl -n myapp create secret tls selfsecret --key tls.key --cert tls.crt
Helpful links on the topic
In lieu of conclusion — here is a small list of similar publications and cheat sheets’ collections we’ve found online:
- The official cheatsheet from the Kubernetes documentation;
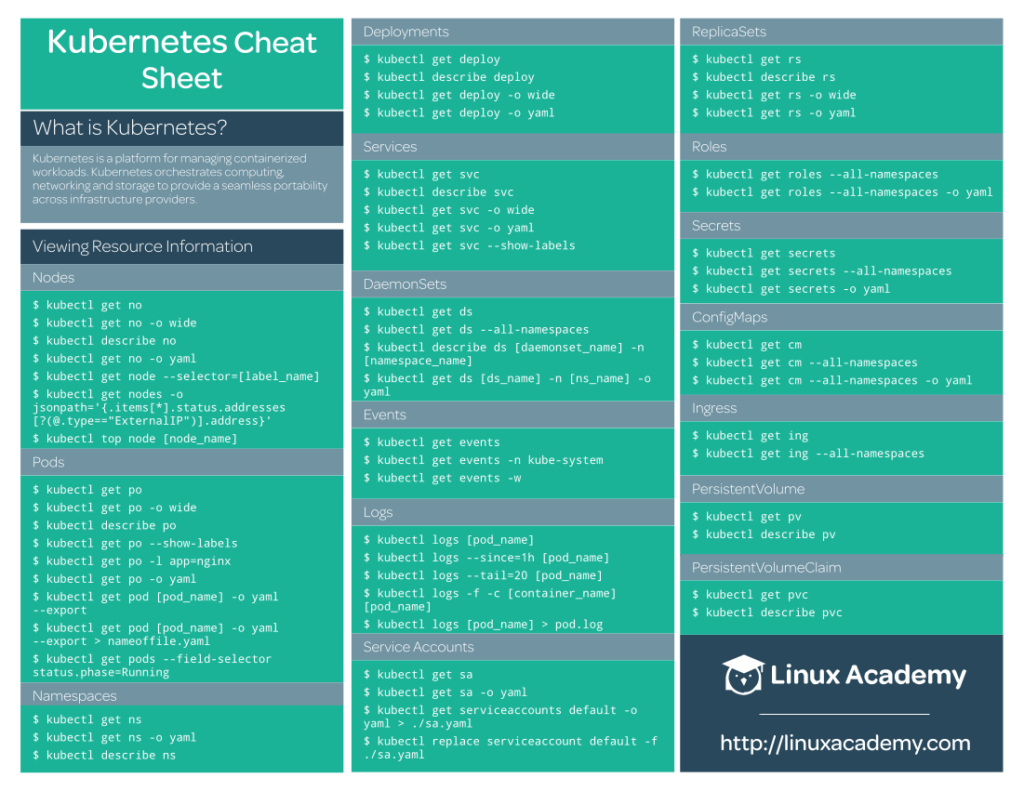
- A short practical introduction plus a detailed 2-page table by Linux Academy. It provides novice engineers with all the basic kubectl commands at a glance:
- An exhaustive list of commands by Blue Matador divided into sections;
- A gist compilation of links to kubectl cheatsheets, articles on the topic, as well as some commands;
- The Kubernetes-Cheat-Sheet GitHub repository by another enthusiast containing kubectl commands categorized by topics;
- The kubectl-aliases GitHub repository which is a real paradise for alias lovers.



Comments