We have been using Vector to collect logs in our Kubernetes platform for years, successfully applied it in production for various customers’ needs, and enjoyed this experience a lot. Thus, I’d like to share it with a bigger community so that more K8s operators may see the potential and consider the benefits for their own setups.
To do so, I’ll start with a brief recap of what types of information can be collected in Kubernetes. Then, I will explore Vector, its architecture, and why we like it so much. Finally, I will share our practical use cases and real-life experiences with Vector.
NB: This article is based on my recent talk. You can find the presentation and video at the end of this text.
Logging in Kubernetes
Let’s have a look at logs in Kubernetes. While the primary objective of Kubernetes is to run containers on nodes, it is essential to remember that these containers are typically developed according to the 12 factors of Heroku. So, how do they produce logs in Kubernetes, who are the other producers, and where do the logs reside?
1. Applications’ (pods’) logs
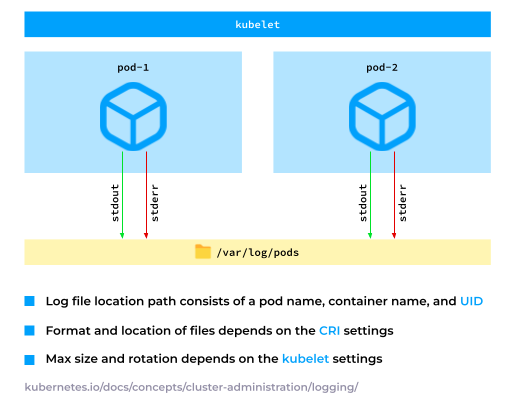
The applications that you run in K8s write their logs to stdout or stderr. The container runtime then collects and stores these logs in a directory, which is typically /var/log/pods. It is configurable and can be customized for specific requirements.
2. Node services’ logs
On top of that, there are services on Kubernetes nodes running outside of containers, such as containerd and kubelet.
It is crucial to keep those services in mind and collect the relevant messages from syslog, such as the SSH authentication messages.
Additionally, there are instances where containers write their logs to specific file paths. For example, kube-apiserver, which usually writes audit logs. Consequently, these logs need to be collected from the respective nodes.
3. Events
Another significant aspect of Kubernetes log collection is events. These feature a unique structure as they solely exist in etcd, so in order to collect them, you have to make a request to the Kubernetes API.
Events can be treated as metrics due to the reason field (see the example manifest below), which identifies the event, and the count field, which functions as a counter, incrementing as more and more events are logged.
Furthermore, events can also be collected as traces, featuring firstTimestamp and lastTimestamp fields, which facilitate the creation of comprehensive Gantt diagrams that illustrate all the events in a cluster.
Lastly, events offer human-readable messages (the message field), enabling them to be collected as logs.
apiVersion: v1
kind: Event
count: 1
metadata:
  name: standard-worker-1.178264e1185b006f
  namespace: default
reason: RegisteredNode
firstTimestamp: '2023-09-06T19:08:47Z'
lastTimestamp: '2023-09-06T19:08:47Z'
involvedObject:
  apiVersion: v1
  kind: Node
  name: standard-worker-1
  uid: 50fb55c5-d97e-4851-85c6-187465154db6
message: 'Registered Node standard-worker-1 in Controller'
Essentially, Kubernetes can collect pod logs, node service logs, and events. However, in this article, we will focus on pod logs and node service logs since events require additional software to scrape them, which involves the Kubernetes API, thus extending it beyond our scope.
What is Vector
Now, let’s see what Vector is all about.
Vector distinctive features (and why we use it)
According to the official website, Vector is a “lightweight, ultra-fast tool for building observability pipelines”. However, as a Vector user, I would like to reword this definition slightly, emphasizing the features that are most relevant to our cases:
Vector is an Open Source, efficient tool for building log-collection pipelines.
What is so important in this definition for us?
- Being Open Source is a must for us to build trusted, enduring solutions on it and to recommend it to others.
- Another significant factor is Vector’s efficiency. If a tool is lightweight but cannot handle substantial amounts of data, it fails to meet our requirements. In the same vein, if a tool is ultra-fast but consumes a lot of resources, it also does not fit as a log collector. Thus, efficiency plays a critical role.
- It is worth mentioning that Vector’s capability to collect other types of data doesn’t really matter to us, as our current focus is on logs.
One of Vector’s exceptional features is its vendor agnosticism. Despite being owned by Datadog, Vector integrates seamlessly with various other vendors’ solutions, including Splunk, Grafana Cloud, and Elasticsearch Cloud. This flexibility ensures that a single software solution can be employed across multiple vendors.
Another delightful perk Vector provides is it eliminates the need to rewrite your Go application in Rust to enhance its performance. Vector is already written in Rust.
Moreover, it is designed to be highly performant. How is this achieved? Vector features a CI system which runs benchmarking tests on any proposed pull requests. Maintainers rigorously evaluate the impact new features have on Vector’s performance. In the case that any adverse effects materialize, the contributors are requested to rectify the issues promptly, as performance remains a key priority for the Vector team.
Furthermore, Vector makes for a flexible building block, but we’ll have more on that below.
Vector’s architecture
As a processing tool, Vector collects data from various sources. It does this by either scraping or acting as an HTTP server that accumulates data ingested by other tools.
Vector excels at transforming log entries and can modify, drop, or aggregate multiple messages into one. (Don’t be fooled by the number of transforms illustrated in the architecture diagram below — it has much more to offer.)
Following this transformation, Vector processes the messages and forwards them to a storage or queue system.
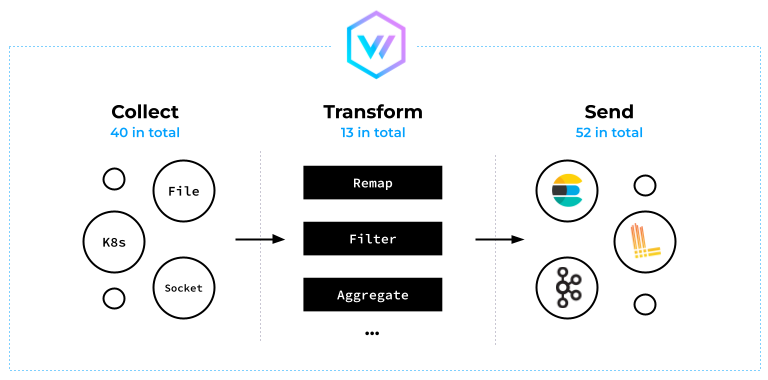
Vector incorporates a powerful transformation language known as the Vector Remap Language (VRL), allowing for an infinite number of possible transformations.
Vector Remap Language examples
Let’s take a quick look at VRL and start with log filtering. In the snippet below, we use a VRL expression to ensure the severity field is not equal to info:
[transforms.filter_severity]
type = "filter"
inputs = ["logs"]
condition = '.severity != "info"'
When Vector collects pod logs, it also enriches the log lines with additional pod metadata, such as the pod name, pod IP, and pod labels. However, in the pod labels, there may be some labels that only the Kubernetes controllers use and, therefore, bear no value to the human user. For optimal storage performance, we recommend dropping these labels:
[transforms.sanitize_kubernetes_labels]
type = "remap"
inputs = ["logs"]
source = '''
  if exists(.pod_labels."controller-revision-hash") {
    del(.pod_labels."controller-revision-hash")
  }
  if exists(.pod_labels."pod-template-hash") {
    del(.pod_labels."pod-template-hash")
  }
'''
Here’s an example of how multiple log lines can be concatenated into a single line:
[transforms.backslash_multiline]
type = "reduce"
inputs = ["logs"]
group_by = ["file", "stream"]
merge_strategies."message" = "concat_newline"
ends_when = '''
  matched, err = match(.message, r'[^\\]$');
  if err != null {
    false;
  } else {
    matched;
  }
'''
In this case, the merge_strategies field adds a newline symbol to the message field. On top of that, the ends_when section uses a VRL expression to check whether a line ends with a backslash (in the way multiline Bash comments are concatenated).
Log collecting topologies
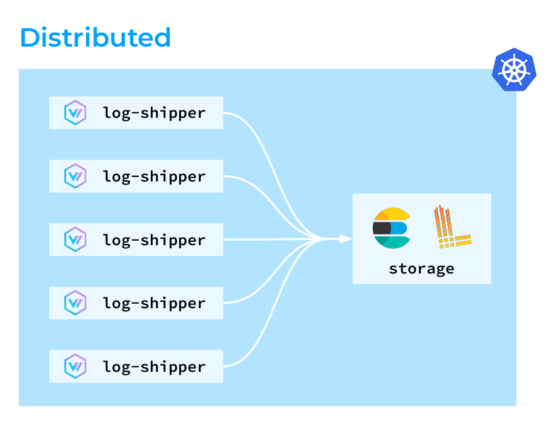
Ok, it’s time to explore a few different log-collecting topologies to use with Vector. The first one is the distributed topology, where Vector agents are deployed on all the nodes within the Kubernetes cluster. Those agents then collect, transform, and directly send logs to storage.
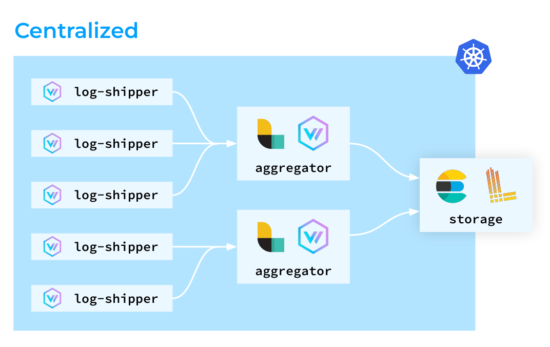
The second one is the centralized topology. In it, Vector agents also run on all the nodes, although they don’t perform any complex transformations: the aggregators handle those instead. The good thing about this type of setup is its superior load predictability. You can deploy dedicated nodes for aggregators and scale them if necessary, optimizing Vector’s resource consumption on the cluster nodes.
The third topology is the stream-based approach. In it, Kubernetes pods “get rid of” logs as quickly as possible. The logs are directly ingested into storage, and then Elasticsearch parses the log lines and adjusts the indexes, which can be a resource-intensive process. Still, in Kafka’s case, messages are treated simply as strings. So we can easily retrieve those logs from Kafka for further storage and analysis.
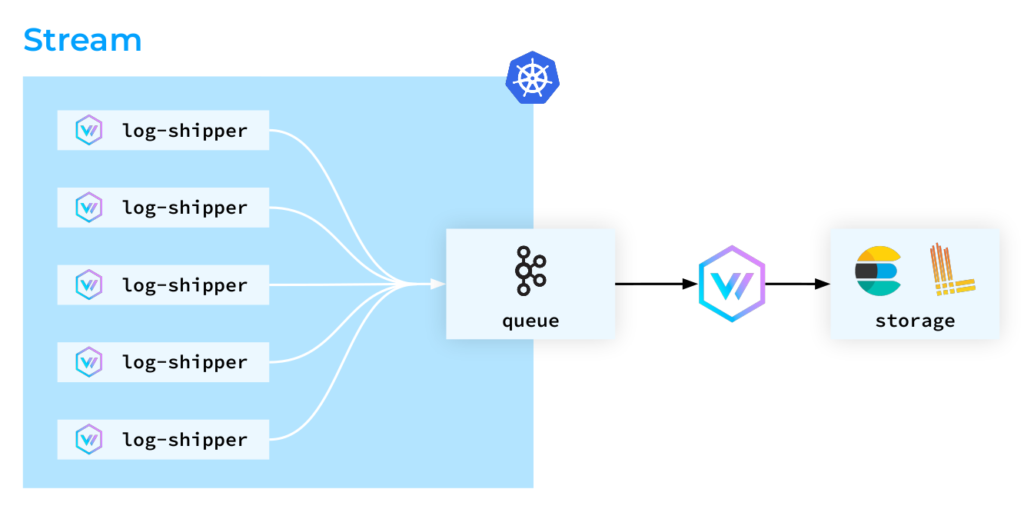
Please note that in this article, we will not cover the topologies in which Vector acts as an aggregator. Instead, we will focus solely on its role as a log collection agent on cluster nodes.
Vector in Kubernetes
How will we see Vector in Kubernetes? Let’s have a look at the pod below:
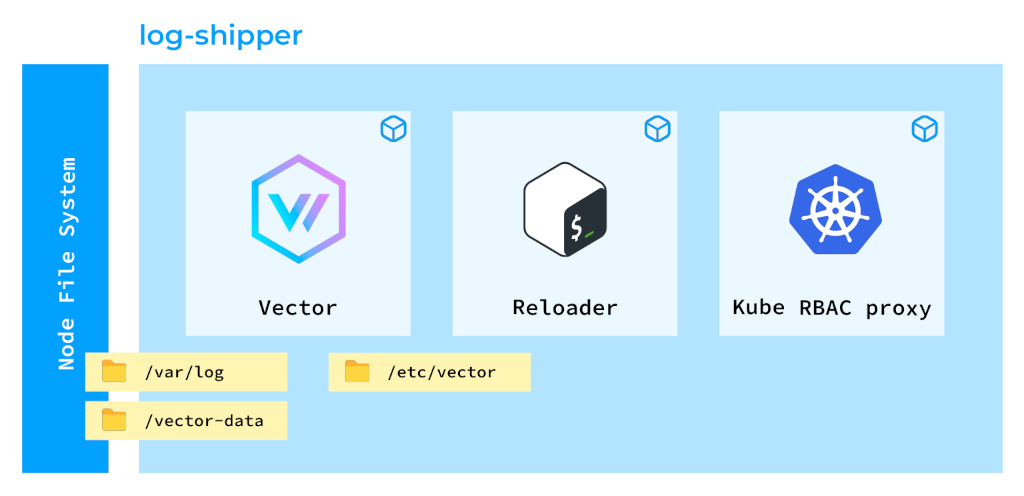
Such a design might look quite sophisticated at first, but there’s a reason behind that. We have three containers in this pod:
- The first one runs Vector itself. Its main purpose is to collect logs.
- The second container, known as Reloader, enables our platform users to create their own log collection and ingestion pipelines. We have a special operator that assumes user-defined rules and generates a configuration map for Vector. The Reloader container validates that configuration map and reloads Vector accordingly.
- The third container, Kube RBAC proxy, plays a vital role, as Vector exposes various metrics regarding the log lines it collects. Since this information can be sensitive, it’s essential that it’s protected with proper authorization.
Vector is deployed as a DaemonSet (see the listing below) because we have to deploy its agents on all the nodes in the Kubernetes cluster.
In order to collect logs effectively, we need to mount additional directories to Vector:
- The
/var/logdirectory because, as discussed before, all pods’ logs are stored there. - On top of that, we need to mount a persistent volume to Vector, which is used to store checkpoints. Each time Vector sends a log line, it writes a checkpoint to avoid duplicating logs sent to the same storage.
- Furthermore, we mount the
localtimeto see the node’s time zone.
apiVersion: apps/v1
kind: DaemonSet
volumes:
- name: var-log
  hostPath:
    path: /var/log/
- name: vector-data-dir
  hostPath:
    path: /mnt/vector-data
- name: localtime
  hostPath:
    path: /etc/localtime
volumeMounts:
- name: var-log
  mountPath: /var/log/
  readOnly: true
terminationGracePeriodSeconds: 120
shareProcessNamespace: true
Few other notes on this listing:
- When mounting the
/var/logdirectory, it is crucial to remember to enable thereadOnlymode. This precautionary measure prevents unauthorized modification of log files. - We use a termination grace period (120 seconds) to ensure that Vector completes all tasks assigned to it before it restarts.
- Sharing the process namespace is essential to enable the Reloader to send a signal to Vector to restart it.
This sums up our setup to deploy Vector in Kubernetes.
Next, let’s move on to the most intriguing part — practical use cases. All of them are not hypothetical scenarios — they are real-world outages we have encountered during our duty shifts.
Practical use cases
Case #1: Device ran out of space
One day, all the pods were evicted from a node due to a lack of disk space. We initiated an investigation and discovered that Vector actually keeps deleted files. Now, why did that happen?
- Vector monitors files in the
/var/log/podsdirectory. - While the application is actively writing logs, the file size overgrows the 10 megabytes limit to 20, 30, 40, 50… megabytes.
- At some point, kubelet rotates the log file, bringing it back to the original size of 10 megabytes.
- However, at the same moment, Vector tries to send logs to Loki. Unfortunately, Loki cannot handle such a large volume of data!
- Vector, being a responsible software, still intends to send all the logs to storage.
Unfortunately, the applications don’t wait for all those internal operations to finish — they just keep running. This results in Vector trying to retain all the log files, and as kubelet continues to rotate them, the available space on the node depletes.

So, how can this issue be resolved?
- First, you can start off by adjusting the buffer settings. By default, Vector stores all the logs in memory if it cannot send them to storage. The default buffer capacity is limited to just 1,000 messages, which is pretty low. You can extend that up to 10,000.
- Alternatively, changing the behavior from blocking to dropping new logs also may help. With the
drop newestbehavior, Vector would simply discard any logs that it cannot accommodate in its buffer. - Another option is to use a disk buffer instead of a memory buffer. The downside is Vector would spend more time on input-output operations. In that case, you have to take your performance requirements into account when deciding whether this approach works for you.
The rule of thumb in eliminating this issue is to employ a stream topology. By allowing the logs to leave the node as quickly as possible, you reduce the risk of disruptions in your production applications. And we certainly don’t want to ruin the production cluster due to monitoring issues, do we?
Finally, if you are brave enough, you could use sysctl to adjust the maximum number of open files for a process. However, I do not recommend this approach.
Case #2: Prometheus “explosion”
Vector operates on a node and performs several different tasks. It collects logs from pods and also exposes metrics such as the number of log lines collected and the number of errors encountered. This is possible thanks to Vector’s exceptional observability feature.
However, many metrics have a specific file label that potentially leads to a high cardinality, which Prometheus can’t digest. This occurs because when pods restart, Vector starts exposing the metrics for the new pods while still retaining the metrics for the old ones, meaning those metrics have different file labels. This behavior is a result of how the Prometheus exporter works (by design). Unfortunately, after several pods’ restarts, this situation leads to a sudden surge in Prometheus’ load and a subsequent “explosion”.
To address this issue, we applied a metrics labelling rule to eliminate the troublesome file label. This fixed the problem for Prometheus — it was now functioning normally.
However, after some time, Vector encountered a problem of its own. The thing is, Vector was consuming more and more memory to store all of these metrics, resulting in a memory leak. To rectify this, we used a global option in Vector called expire_metric_secs:
- If you set it to, say, 60 seconds, Vector would be checking whether it is still collecting data from these pods.
- If not, it would cease exporting metrics for those files.
Although this solution worked effectively, it also impacted some other metrics, such as the Vector component error metrics. As can be seen in the graph below, seven errors were initially recorded, but after the expiration was triggered, there was a gap in the data.
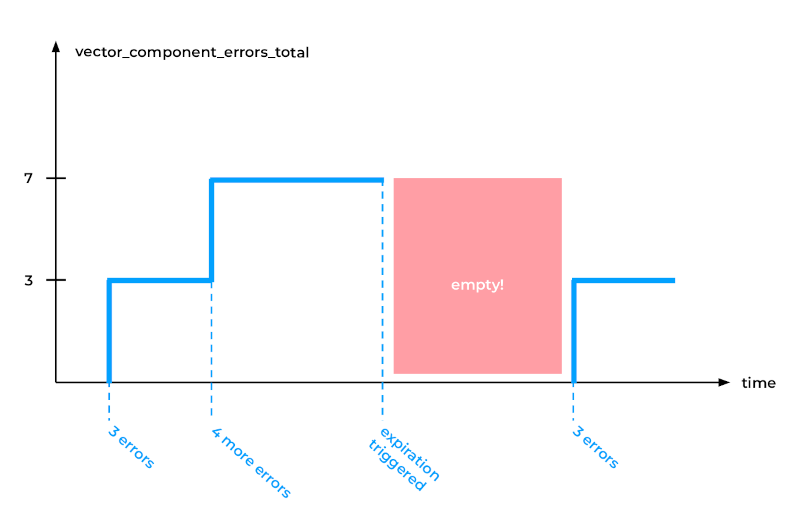
Unfortunately, Prometheus, particularly the PromQL rate function (and similar), cannot handle such gaps in data. Instead, Prometheus expects the metric to be exposed for the entire time period.
To resolve this limitation, we modified Vector’s code to eliminate the file label completely — by simply removing the ”file” entry in a few places. This workaround proved successful in addressing the issue.
Case #3: Kubernetes control plane outage
One day, we noticed that the Kubernetes control plane tended to fail when Vector instances restarted simultaneously. Upon analyzing our dashboards, we determined that this issue stemmed from excessive memory usage, primarily etcd memory consumption.
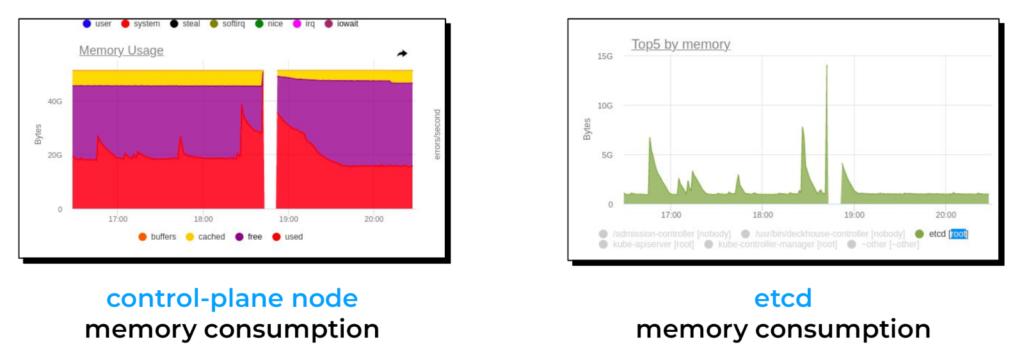
To gain a better understanding of the root cause, we first needed to delve into the internal workings of the Kubernetes API.
When a Vector instance started, it made a LIST request to the Kubernetes API to populate the cache with pod metadata. As discussed earlier, Vector relies on this metadata to enrich log entries.

Consequently, each Vector instance requested the Kubernetes API to provide the metadata for pods on the same node Vector was running on. However, for each individual request, the Kubernetes API reads from etcd.
etcd functions as a key-value database. The keys are composed of the resource’s kind, namespace, and name. For every request involving 110 pods on a node, the Kubernetes API accesses etcd and retrieves all the pods’ data. This results in a spike in memory usage for both kube-apiserver and etcd, ultimately leading to their failure.

There are two potential solutions to this issue. First, we can employ a cache read approach. In this approach, we instruct the API server to read from its existing cache instead of etcd. Although inconsistencies may arise in certain situations, this is acceptable for monitoring tools. Unfortunately, such a feature was not available in the Kubernetes Rust client. Thus, we submitted a pull request to Vector, enabling the use_apiserver_cache=true option.
The second solution involves leveraging a unique feature of the Kubernetes Priority and Fairness API. The thing is, you can define a request queue:
apiVersion: flowcontrol.apiserver.k8s.io/v1beta1
kind: PriorityLevelConfiguration
metadata:
  name: limit-list-custom
spec:
  type: Limited
  limited:
    assuredConcurrencyShares: 5
    limitResponse:
      queuing:
        handSize: 4
        queueLengthLimit: 50
        queues: 16
      type: Queue
… and associate it with specific service accounts:
apiVersion: flowcontrol.apiserver.k8s.io/v1beta1
kind: FlowSchema
metadata:
  name: limit-list-custom
spec:
  priorityLevelConfiguration:
    name: limit-list-custom
  distinguisherMethod:
    type: ByUser
  rules:
  - resourceRules:
    - apiGroups: [""]
      clusterScope: true
      namespaces: ["*"]
      resources: ["pods"]
      verbs: ["list", "get"]
    subjects:
    - kind: ServiceAccount
      serviceAccount:
        name: ***
        namespace: ***
Such a configuration allows you to limit the number of concurrent preflight requests and effectively reduce the severity of spikes, thus minimizing their impact. (We covered this topic in more detail in another article.)
Finally, instead of relying on the Kubernetes API, you can use the kubelet API to obtain pod metadata by sending requests to the /pods endpoint. However, this feature has not yet been implemented in Vector.
Conclusion
Vector is great for platform engineering endeavors owing to its flexibility, versatility and breadth of log ingestion and transfer options. I wholeheartedly recommend Vector and encourage you to take full advantage of its capabilities.
P.S. Video & slides
Here’s the full video version of this talk as it was presented during Kubernetes Community Days (KCD) Austria 2023:
Please accept YouTube cookies to play this video. By accepting you will be accessing content from YouTube, a service provided by an external third party.
If you accept this notice, your choice will be saved and the page will refresh.
The presentation slides from this talk are available below:
Thank you for reading and (probably) watching! Feel free to share your experiences with Vector in the comments below.


Thank you for this blog post.But I encountered a problem when deploying kubernetes according to values.yaml. All pods are normal with no error logs, but the logs cannot be collected. When checking through http://http//127.0.0.1:8686/graphql, there is no traffic for source kubernetes_log. The only difference is that this cluster specifically specifies “graph”: “/data/docker/path”.Can you give me some advice ? Thanks very much!
Hi! This seems to be a general issue with using Vector. Instead of discussing it here, we would recommend using the project’s official resources to solve it, such as:
Thank you for this blog post. I’m wonder how do you set severity for logs? By default the severity field not present in Vector.dev logs for Kubernetes. There is stream filed but we found its misleading in some cases (it could contain normal not war\error messages).
Hi! Typically, we collect logs in JSON, and we get the severity level from the application’s log itself. If there’s no severity, we will set a default one.
Here’s a VRL example you can use in remap:
default_severity = 4; parsed_data, err = parse_json(.message) if err != null { .severity = default_severity return } if exists(parsed_data.severity) { .severity = parsed_data.severity } else { .severity = default_severity }Dmitry, thank you for the response. We collect also logs from apps that unfortunatelly don’t provide severity filed. We thought that we could use stream to filed from Kubernetes source but for our logs it always stderr (https://github.com/vectordotdev/vector/discussions/19374). But of course stream is not so reliable in any way but…
Update url: https://github.com/vectordotdev/vector/discussions/19396
I have always been a huge admirer of your technical articles, and they have served as a valuable source of inspiration for me.
I recently started exploring observability tools for Kubernetes, and after careful consideration, I opted for the LGTM stack (Loki, Grafana, Tempo, Mimir).
The primary reason for my choice is the compatibility of these tools with the OpenTelemetry Protocol.
This allows all signals (logs, metrics, and traces) to be collected and processed by the OTel Collector.
I am interested in your perspective on OpenTelemetry and Vector. Which do you consider superior, or is collaboration between them possible?
Hi Mango, and first of all, thank you so much for your kind words about our blog!
Here’s our take on your question. Basically, Vector is a pipe. You need it to transfer your telemetry from one place (source) to another (sink) and probably to process this data (transform) along the way. You can use it to collect data and send it to your collector using Kafka or from S3 for better reliability of this process.
The problem with Vector is that it doesn’t fully support OTel at the moment. You can find more details in this long-standing issue. Thus, we wouldn’t recommend using it for traces specifically. Hopefully, it answers your question but feel free to clarify any details you need.