Chaos engineering for Kubernetes gets more and more popular, and rightly so: after all, K8s was designed with the ideas of availability and resiliency in mind. Therefore these marvelous features must be tested on real-life projects occasionally.
Fortunately, there are many Open Source solutions available that can help you with experimenting. Hopefully our review of them will be useful in your adventure. But let me start with a brief introduction…
A bit of history
The story of chaos engineering begins in 2011. That year, Netflix developers came up with the idea that only redundant and distributed infrastructure can guarantee a high level of fault tolerance. They put this idea to practice by creating so-called Chaos Monkey.
This “monkey” regularly kills a random instance of some service (whether it is a virtual machine or a container), allowing you to analyze system behavior under such conditions. The growing infrastructure and overall evolution of the platform have led to the emergence of Chaos Kong, a service that kills the entire AWS region… Sounds like a really massive fault tolerance testing, doesn’t it?
That said, the variety of available actions for chaos engineering is much larger than just “killing” services. The main purpose of this new science is to detect possible problems that are either not properly fixed or not detected/reproduced in a consistent manner. That is why testing is not limited to plain killing: you also have to skillfully inject chaos in I/O, break network connections, burn CPU and memory, etc… The most advanced tools can even fragment memory pages in the kernel of a running pod (hey cgroups, how is that possible?).
But I will not delve into details of chaos engineering per se. Those interested may refer to this excellent set of articles by Adrian Hornsby.
And we’re getting back to “classic” Chaos Monkey: this tool created by Netflix is still used by this streaming service. Currently, it is integrated with the Spinnaker continuous delivery platform, so it works with any of its supported backends: AWS, Google Compute Engine, Azure, Kubernetes, Cloud Foundry.
However, this convenience has its downsides. Installing/configuring Chaos Monkey for Kubernetes (bundled with Spinnaker) is not as simple as installing via a Helm chart… Below, we will consider chaos engineering tools designed purposefully for K8s.
1. kube-monkey
- GitHub: https://github.com/asobti/kube-monkey
- GitHub stars / contributors: ~2000 / 30
- Written in: Go
It is one of the oldest chaos tools designed for Kubernetes: the first public commits in its repository were made in December 2016. Let’s test it on a deployment consisting of five nginx replicas (while showing you its capabilities along the way).
Here is our testing manifest:
---
apiVersion: v1
kind: Namespace
metadata:
  name: test-monkeys
spec:
  finalizers:
  - kubernetes
---
apiVersion: apps/v1
kind: Deployment
metadata:
  name: nginx
  namespace: test-monkeys
spec:
  selector:
    matchLabels:
      app: nginx
  replicas: 5
  template:
    metadata:
      labels:
        app: nginx
    spec:
      containers:
      - name: nginx
        image: nginx:1.16
        ports:
        - containerPort: 80
---
The ready-made kube-monkey chart is the easiest way to install and run this utility:
$ git clone https://github.com/asobti/kube-monkey
$ cd kube-monkey/helm
We need to slightly modify the example command given in README.md so that our monkey can live in its own namespace. It must start running at midnight and stop at 11 p.m. (this kind of a timetable suited us perfectly at the time of writing of this article):
$ helm install -n kubemonkey --namespace kubemonkey --set config.dryRun=false --set config.runHour=0 \
 --set config.startHour=1 --set config.endHour=23 --set config.timeZone=Europe/London \
 --set config.debug.schedule_immediate_kill=true --set config.debug.enabled=true kubemonkey
Now we can unleash the power of the monkey and attack our victim — the nginx deployment — using labels. Kube-monkey adheres to the opt-in principle. In other words, it kills only those resources that are permitted to be killed:
$ kubectl -n test-monkeys label deployment nginx kube-monkey/enabled=enabled
$ kubectl -n test-monkeys label deployment nginx kube-monkey/kill-mode=random-max-percent
$ kubectl -n test-monkeys label deployment nginx kube-monkey/kill-value=100
$ kubectl -n test-monkeys label deployment nginx kube-monkey/identifier=nginx
A few notes on labels:
- The second and third labels (
kill-mode,kill-value) instruct kube-monkey to kill a random number (up to 100%) of pods that are a part of StatefulSets/Deployments/DaemonSets. - The fourth label (
identifier) specifies a unique label that kube-monkey will use to find victims. - The fifth label (
mtbf— mean time between failure) sets out the interval between killings (it equals to 1 by default).
I have a feeling that five labels are way too much to just kill anyone… Plus, there is a pull request to allow setting mtbf in, e.g., hours (to commit our evil deeds more often) in addition to days. While it was stale for a long time, we could see some updates in November’20, thus some progress is expected.
Now, if you take a look at monkey logs, you will see the following:
I0831 18:14:53.772484       1 kubemonkey.go:20] Status Update: Generating next schedule in 30 sec
I0831 18:15:23.773017       1 schedule.go:64] Status Update: Generating schedule for terminations
I0831 18:15:23.811425       1 schedule.go:57] Status Update: 1 terminations scheduled today
I0831 18:15:23.811462       1 schedule.go:59] v1.Deployment nginx scheduled for termination at 08/31/2020 21:16:11 GMT
I0831 18:15:23.811491       1 kubemonkey.go:62] Status Update: Waiting to run scheduled terminations.

********** Today's schedule **********
k8 Api Kind    Kind Name        Termination Time
-----------    ---------        ----------------
v1.Deployment    nginx        08/31/2020 21:16:11 GMT
********** End of schedule **********
Hooray! Our chaos monkey has detected a deployment and scheduled termination of one or more replicas. Now we just have to wait… But what’s that!?
E0831 18:16:11.869463 1 kubemonkey.go:68] Failed to execute termination for v1.Deployment nginx. Error: v1.Deployment nginx has no running pods at the momentIf you look carefully at the manual, you will see the following notice (with an outdated apiVersion, unfortunately):
For newer versions of kubernetes you may need to add the labels to the k8s app metadata as well.
---
apiVersion: extensions/v1beta1
kind: Deployment
metadata:
  name: monkey-victim
  namespace: app-namespace
  labels:
    kube-monkey/enabled: enabled
    kube-monkey/identifier: monkey-victim
    kube-monkey/mtbf: '2'
    kube-monkey/kill-mode: "fixed"
    kube-monkey/kill-value: '1'
spec:
  template:
    metadata:
      labels:
        kube-monkey/enabled: enabled
        kube-monkey/identifier: monkey-victim
[... omitted ...]
Okay, let’s replace our to-be-terminated deployment template with:
---
apiVersion: apps/v1
kind: Deployment
metadata:
  name: nginx
  namespace: test-monkeys
  labels:
    kube-monkey/enabled: enabled
    kube-monkey/identifier: nginx
    kube-monkey/kill-mode: random-max-percent
    kube-monkey/kill-value: "100"
    kube-monkey/mtbf: "1"
spec:
  selector:
    matchLabels:
      app: nginx
  replicas: 5
  template:
    metadata:
      labels:
        app: nginx
        kube-monkey/enabled: enabled
        kube-monkey/identifier: nginx
    spec:
      containers:
      - name: nginx
        image: nginx:1.16
        ports:
        - containerPort: 80
---
Now everything went smoothly:
I0831 18:24:20.434516       1 kubemonkey.go:20] Status Update: Generating next schedule in 30 sec
I0831 18:24:50.434838       1 schedule.go:64] Status Update: Generating schedule for terminations
    ********** Today's schedule **********
    k8 Api Kind    Kind Name        Termination Time
    -----------    ---------        ----------------
    v1.Deployment    nginx        08/31/2020 21:25:03 GMT
    ********** End of schedule **********
I0831 18:24:50.481865       1 schedule.go:57] Status Update: 1 terminations scheduled today
I0831 18:24:50.481917       1 schedule.go:59] v1.Deployment nginx scheduled for termination at 08/31/2020 21:25:03 GMT
I0831 18:24:50.481971       1 kubemonkey.go:62] Status Update: Waiting to run scheduled terminations.
I0831 18:25:03.540282       1 kubemonkey.go:70] Termination successfully executed for v1.Deployment nginx
I0831 18:25:03.540324       1 kubemonkey.go:73] Status Update: 0 scheduled terminations left.
I0831 18:25:03.540338       1 kubemonkey.go:76] Status Update: All terminations done.
I0831 18:25:03.540499       1 kubemonkey.go:19] Debug mode detected!
I0831 18:25:03.540522       1 kubemonkey.go:20] Status Update: Generating next schedule in 30 sec
It works well and very expressly. Still, the configuration process is way more complicated than it could be, and there are very few features. Plus, I noticed some oddities as well:
I0831 18:30:33.163500       1 kubemonkey.go:19] Debug mode detected!
I0831 18:30:33.163513       1 kubemonkey.go:20] Status Update: Generating next schedule in 30 sec
I0831 18:31:03.163706       1 schedule.go:64] Status Update: Generating schedule for terminations
I0831 18:31:03.204975       1 schedule.go:57] Status Update: 1 terminations scheduled today
    ********** Today's schedule **********
    k8 Api Kind    Kind Name        Termination Time
    -----------    ---------        ----------------
    v1.Deployment    nginx        08/31/2020 21:31:45 GMT
    ********** End of schedule **********
I0831 18:31:03.205027       1 schedule.go:59] v1.Deployment nginx scheduled for termination at 08/31/2020 21:31:45 GMT
I0831 18:31:03.205080       1 kubemonkey.go:62] Status Update: Waiting to run scheduled terminations.
E0831 18:31:45.250587       1 kubemonkey.go:68] Failed to execute termination for v1.Deployment nginx. Error: no terminations requested for v1.Deployment nginx
I0831 18:31:45.250634       1 kubemonkey.go:73] Status Update: 0 scheduled terminations left.
I0831 18:31:45.250649       1 kubemonkey.go:76] Status Update: All terminations done.
I0831 18:31:45.250828       1 kubemonkey.go:19] Debug mode detected!
2. chaoskube
- GitHub: https://github.com/linki/chaoskube
- GitHub stars / contributors: ~1300 / 20+
- Written in: Go
This tool also boasts a long history: its first release took place in November 2016. Chaoskube provides a ready-made chart and a comprehensive manual for it. By default, it starts in the dry-run mode, so no resource gets hurt.
Let’s run it on a basic nginx deployment that resides in the test-monkey namespace and add the parameter to create an RBAC role (since the default role has insufficient privileges):
$ helm install --name chaoskube --set dryRun=false --set namespaces="test-monkeys" \
 --set rbac.create=true --set rbac.serviceAccountName=chaoskube stable/chaoskube
… things are moving. Cool!
$ kubectl -n default logs chaoskube-85f8bf9979-j75qm
time="2020-09-01T08:33:11Z" level=info msg="starting up" dryRun=false interval=10m0s version=v0.14.0
time="2020-09-01T08:33:11Z" level=info msg="connected to cluster" master="https://10.222.0.1:443" serverVersion=v1.16.10
time="2020-09-01T08:33:11Z" level=info msg="setting pod filter" annotations= excludedPodNames="" includedPodNames="" labels= minimumAge=0s namespaces=test-monkeys
time="2020-09-01T08:33:11Z" level=info msg="setting quiet times" daysOfYear="[]" timesOfDay="[]" weekdays="[]"
time="2020-09-01T08:33:11Z" level=info msg="setting timezone" location=UTC name=UTC offset=0
time="2020-09-01T08:33:11Z" level=info msg="terminating pod" name=nginx-594cc45b78-8kf64 namespace=test-monkeys
time="2020-09-01T08:43:11Z" level=info msg="terminating pod" name=nginx-594cc45b78-t7wx7 namespace=test-monkeys
time="2020-09-01T08:53:11Z" level=info msg="terminating pod" name=nginx-594cc45b78-8fg9q namespace=test-monkeys
time="2020-09-01T09:03:11Z" level=info msg="terminating pod" name=nginx-594cc45b78-wf5vg namespace=test-monkeys
You can configure any parameter you might need: the time zone, temporary exceptions, labels to select victim pods, and exceptions.
Chaoskube is a useful, convenient, and easy-to-use tool. However, it can only kill pods (just like kube-monkey).
3. Chaos Mesh
- GitHub: https://github.com/chaos-mesh/chaos-mesh
- GitHub stars / contributors: ~3300 / 80+
- Written in: Go
Chaos Mesh consists of two components:
- Chaos Operator is its main component, which in turn consists of:
- controller-manager (manages Custom Resources),
- chaos-daemon (a privileged DaemonSet capable of managing network, cgroups, etc.),
- sidecar container that is dynamically inserted into the target pod to interfere with the I/O of the target application.
- Chaos Dashboard is a web interface for managing and monitoring the chaos operator.
The project is part of CNCF (since July’20) and is being developed by PingCAP. This company is also known for TiDB — a distributed, Open Source, cloud-native SQL database for real-time analytics.
As you can see, Chaos Operator uses CRDs to define chaos objects. There are several types of them: PodChaos, PodIoChaos, PodNetworkChaos, DNSChaos, NetworkChaos, IOChaos, TimeChaos, StressChaos, and KernelChaos. And here is the list of actions (experiments) available:
- pod-kill — kills the selected pod;
- pod-failure — the pod is unavailable for specified time;
- container-kill — the selected container is killed in the pod;
- netem chaos — network delays, packet repeats;
- network-partition — simulates network partition;
- IO chaos — problems with disks and reading/writing;
- time chaos — injects clock skew into the selected pod;
- cpu-burn — stresses the CPU of the selected pod;
- memory-burn — stresses the memory of the selected pod;
- kernel chaos — the victim will face kernel errors, memory page faults, block I/O problems;
- dns chaos — injects DNS-related errors.
After creating the Custom Resource we need, we can specify there the types of actions, labels, and selectors for defining target namespaces or specific pods, as well as the duration and schedule of experiments — in other words, all the information required for planning some “evil deeds”.
Sounds fascinating, right? Let’s try it out! First, we need to install Chaos Mesh (you can do it using a Helm chart).
The --set dashboard.create=true parameter enables dashboards with beautiful graphs! In a few minutes, you will get a namespace containing a bunch of “lords of chaos” — as yet inactive but ready to crush their victims.
$ kubectl -n chaos-testing get po
NAME                                       READY   STATUS    RESTARTS   AGE
chaos-controller-manager-bb67cb68f-qpmvf   1/1     Running   0          68s
chaos-daemon-krqsh                         1/1     Running   0          68s
chaos-daemon-sk7qf                         1/1     Running   0          68s
chaos-daemon-wn9sd                         1/1     Running   0          68s
chaos-dashboard-7bd8896c7d-t94pt           1/1     Running   0          68s
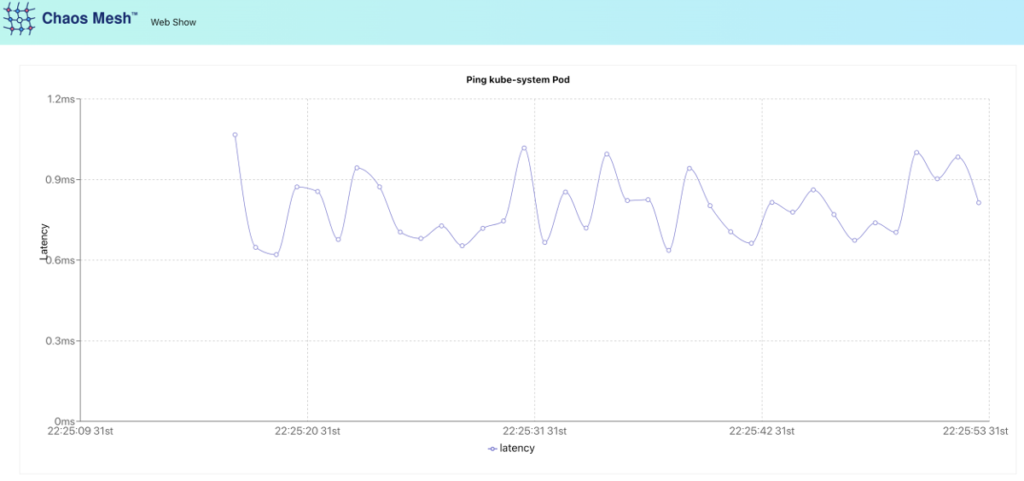
There is a detailed demo manual available that shows the numerous capabilities of the operator. From a technical standpoint, there is deployment.yaml inside the repository (https://github.com/chaos-mesh/web-show). It describes a testing application written in React. Also, there is a service that runs a script to get the IP address of the kube-controller-manager pod (the first one in the list if a multi-master is used). After the start, this pod continuously pings the controller-manager’s pod and visualizes this ping on a graph.
In our case, it makes more sense to expose this graph via the Ingress object rather than using a command contained in deploy.sh (nohup kubectl port-forward svc/web-show --address 0.0.0.0 8081:8081). Therefore, we simply apply Deployment and Service from the repository and define any Ingress so that we can get into the application.
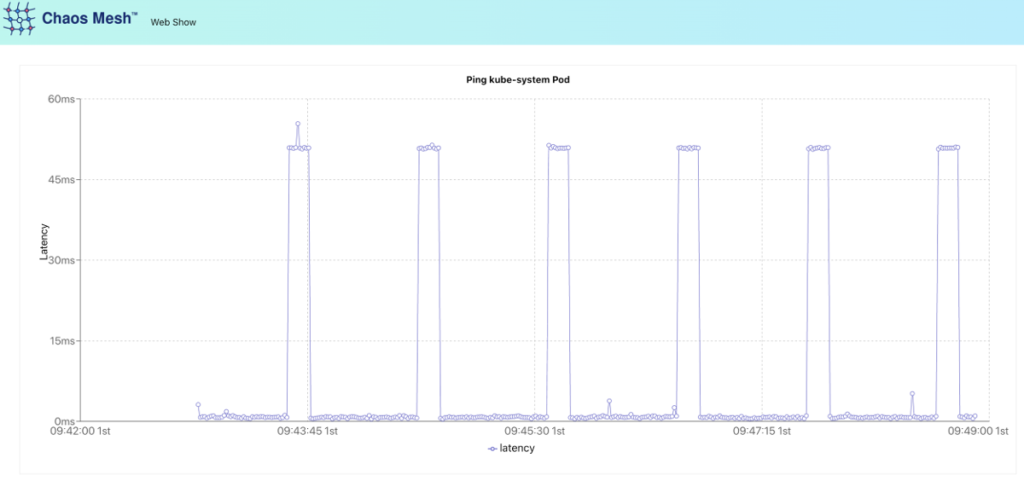
Nice chart! The ST segment shows the patient has an acute heart attack! But wait, this is not a cardiac echo… Now we can summon one of the lords of chaos (slightly adjusting it for greater effect):
apiVersion: chaos-mesh.org/v1alpha1
kind: NetworkChaos
metadata:
  name: web-show-network-delay
spec:
  action: delay # the specific chaos action to inject
  mode: one # the mode to run chaos action; supported modes are one/all/fixed/fixed-percent/random-max-percent
  selector: # pods where to inject chaos actions
    namespaces:
      - test-monkeys
    labelSelectors:
      "app": "web-show"  # the label of the pod for chaos injection
  delay:
    latency: "50ms"
  duration: "10s" # duration for the injected chaos experiment
  scheduler: # scheduler rules for the running time of the chaos experiments about pods.
    cron: "@every 60s"
In the end, we get the beautiful saw-like graph. It shows that netem chaos works as expected. The problem is self-evident here:
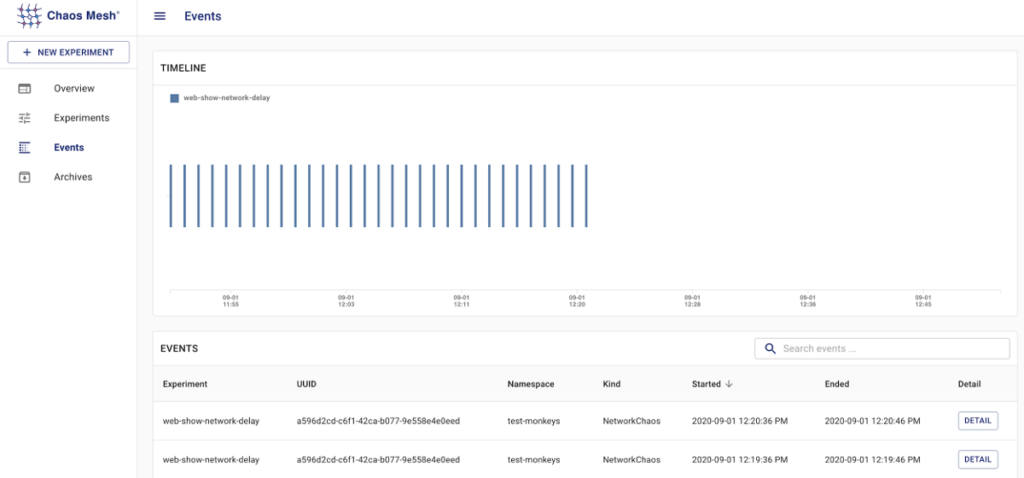
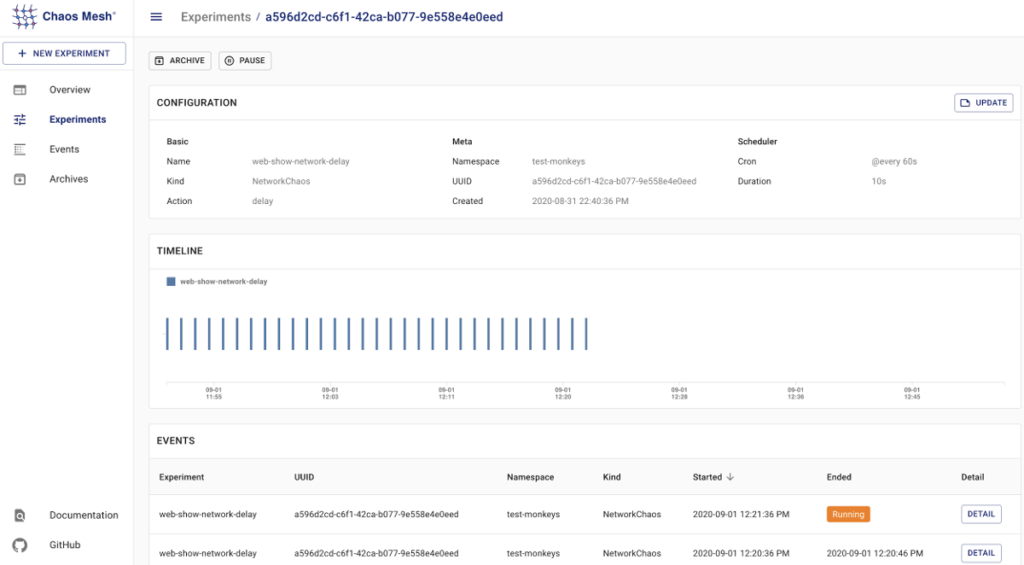
Here’s what chaos-dashboard looks like:
Visualizing events:
Experiment details:
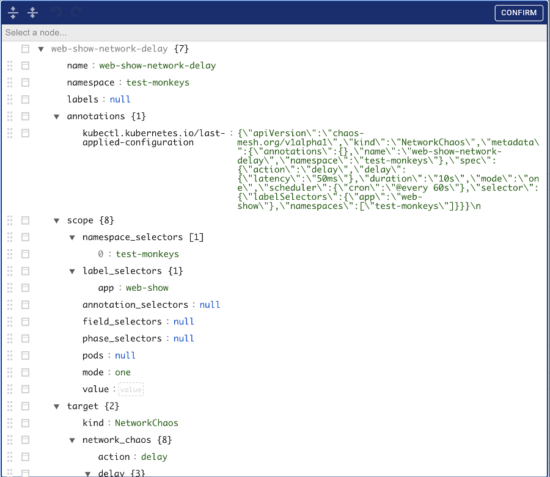
There is even a web editor for Custom Resources available. Sadly, it does not have built-in authorization (but in this case, the authorization is a must!):
It is also worth mentioning that on September 25, 2020 version 1.0 of Chaos Mesh was released indicating its maturity. Since that date, the project has gained a lot of interest: +35% boost in GitHub stars and +60% in contributors.
UPDATE (June 22nd, 2022): Read “Attaining harmony of chaos in Kubernetes with Chaos Mesh” to learn more about our recent experience with this solution.
4. Litmus Chaos
- GitHub: https://github.com/litmuschaos/litmus
- GitHub stars / contributors: ~1600 / 120
- Written in: TypeScript
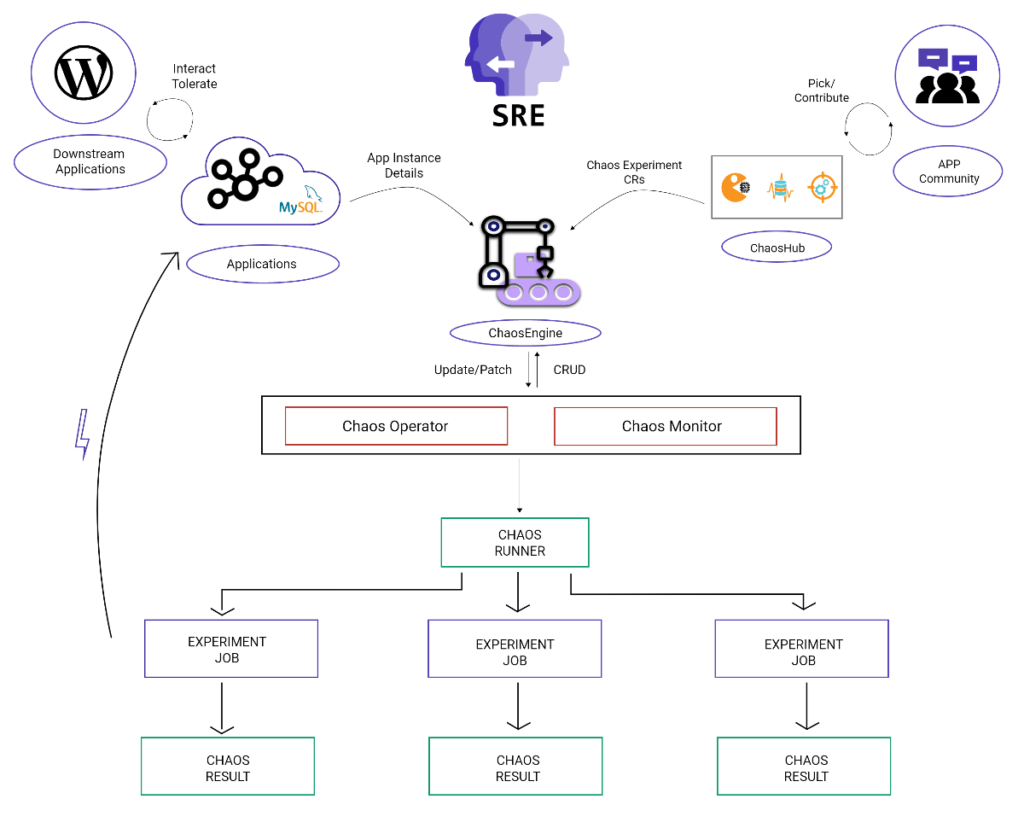
Litmus is another operator to create, manage, and monitor chaos in the Kubernetes cluster. For this, it uses three types of Custom Resources:
ChaosExperimentdefines the experiment itself, required actions, and their schedule;ChaosEngineconnects an application or Kubernetes node to the specificChaosExperiment;ChaosResultstores the results of the experiment. Operator exports it as Prometheus metrics.
Here is a general overview of Litmus workflow:
Now, let’s get our hands dirty. First, install the operator following the documentation:
$ kubectl apply -f https://litmuschaos.github.io/litmus/litmus-operator-v1.9.0.yaml
$ kubectl -n litmus get po
NAME                                 READY   STATUS    RESTARTS   AGE
chaos-operator-ce-797875d477-b4cwx   1/1     Running   0          88s
Check if CRDs are present:
$ kubectl get crds | grep chaos
chaosengines.litmuschaos.io                           2020-10-27T08:58:39Z
chaosexperiments.litmuschaos.io                       2020-10-27T08:58:39Z
chaosresults.litmuschaos.io                           2020-10-27T08:58:39Z
A dedicated repository called ChaosHub provides a large number of ready-made experiments. Let’s create a separate namespace for experimenting and deploy experiments using ChaosHub as a source:
$ kubectl create ns nginx
$ kubectl apply -f https://hub.litmuschaos.io/api/chaos/1.9.0?file=charts/generic/experiments.yaml -n nginx
chaosexperiment.litmuschaos.io/pod-network-duplication created
chaosexperiment.litmuschaos.io/node-drain created
chaosexperiment.litmuschaos.io/node-io-stress created
chaosexperiment.litmuschaos.io/disk-fill created
chaosexperiment.litmuschaos.io/k8-pod-delete created
chaosexperiment.litmuschaos.io/node-taint created
chaosexperiment.litmuschaos.io/pod-autoscaler created
chaosexperiment.litmuschaos.io/pod-cpu-hog created
chaosexperiment.litmuschaos.io/pod-memory-hog created
chaosexperiment.litmuschaos.io/pod-network-corruption created
chaosexperiment.litmuschaos.io/pod-delete created
chaosexperiment.litmuschaos.io/pod-network-loss created
chaosexperiment.litmuschaos.io/disk-loss created
chaosexperiment.litmuschaos.io/k8-pod-delete unchanged
chaosexperiment.litmuschaos.io/pod-io-stress created
chaosexperiment.litmuschaos.io/k8-service-kill created
chaosexperiment.litmuschaos.io/pod-network-latency created
chaosexperiment.litmuschaos.io/k8-pod-delete unchanged
chaosexperiment.litmuschaos.io/k8-pod-delete unchanged
chaosexperiment.litmuschaos.io/node-cpu-hog created
chaosexperiment.litmuschaos.io/docker-service-kill created
chaosexperiment.litmuschaos.io/kubelet-service-kill created
chaosexperiment.litmuschaos.io/k8-pod-delete unchanged
chaosexperiment.litmuschaos.io/node-memory-hog created
chaosexperiment.litmuschaos.io/k8-pod-delete configured
chaosexperiment.litmuschaos.io/container-kill created
This YAML file contains an extensive set of various experiments. For example, one of them duplicates packets coming to the pod, while another drains an application node, and the other one creates I/O stress in the node, etc. All experiments are namespaced resources.
The next steps of the guide help us to add a service account to the namespace and extend the list of resources’ permissions (since we want moar chaos!):
---
apiVersion: v1
kind: ServiceAccount
metadata:
  name: chaos-spawn
  namespace: nginx
  labels:
    name: chaos-spawn
---
apiVersion: rbac.authorization.k8s.io/v1
kind: Role
metadata:
  name: chaos-spawn
  namespace: nginx
  labels:
    name: chaos-spawn
rules:
- apiGroups: ["","litmuschaos.io","batch","apps"]
  resources: ["nodes","pods","deployments","pods/log","pods/exec","events","jobs","chaosengines","chaosexperiments","chaosresults"]
  verbs: ["create","list","get","patch","update","delete","deletecollection"]
---
apiVersion: rbac.authorization.k8s.io/v1
kind: RoleBinding
metadata:
  name: chaos-spawn
  namespace: nginx
  labels:
    name: chaos-spawn
roleRef:
  apiGroup: rbac.authorization.k8s.io
  kind: Role
  name: chaos-spawn
subjects:
- kind: ServiceAccount
  name: chaos-spawn
  namespace: nginx

$ kubectl apply -f rbac.yaml
serviceaccount/pod-delete-sa created
role.rbac.authorization.k8s.io/pod-delete-sa created
rolebinding.rbac.authorization.k8s.io/pod-delete-sa created
Let’s use the following deployment as a victim:
apiVersion: apps/v1
kind: Deployment
metadata:
  name: nginx-deployment
  labels:
    app: nginx
spec:
  replicas: 3
  selector:
    matchLabels:
      app: nginx
  template:
    metadata:
      labels:
        app: nginx
    spec:
      containers:
      - name: nginx
        image: nginx
        ports:
        - containerPort: 80
Check if it has been rolled out successfully:
$ kubectl -n nginx get po
NAME                                READY   STATUS    RESTARTS   AGE
nginx-deployment-85ff79dd56-9bcnn   1/1     Running     0          7s
nginx-deployment-85ff79dd56-lq8r5   1/1     Running     0          7s
nginx-deployment-85ff79dd56-pjwvd   1/1     Running     0          7s
Use resource annotations to limit the blast radius:
$ kubectl -n nginx annotate deploy/nginx-deployment litmuschaos.io/chaos="true"
deployment.apps/nginx-deployment annotated
Define the ChaosEngine Custom Resource (I’d like to remind you that it connects an application to chaos experiments):
apiVersion: litmuschaos.io/v1alpha1
kind: ChaosEngine
metadata:
  name: nginx-chaos
  namespace: nginx
spec:
  appinfo:
    appns: 'nginx'
    applabel: 'app=nginx'
    appkind: 'deployment'
  annotationCheck: 'true'
  engineState: 'active'
  auxiliaryAppInfo: ''
  chaosServiceAccount: chaos-spawn
  monitoring: false
  experiments:
    - name: pod-delete
      spec:
        components:
          env:
            # set chaos duration (in sec) as desired
            - name: TOTAL_CHAOS_DURATION
              value: '30'
            - name: FORCE
              value: 'false'
    - name: pod-cpu-hog
      spec:
        components:
          env:
            - name: CPU_CORES
              value: '4'
            - name: TARGET_CONTAINER
              value: 'nginx'
    - name: pod-memory-hog
      spec:
        components:
          env:
            - name: TARGET_CONTAINER
              value: 'nginx'
Experiments under the standard configuration of ChaosEngine look relatively harmless and gentle. But we want more fun! Therefore, let’s kill the application and burn some CPU and memory.
Note that jobCleanUpPolicy: 'delete' line is missing in the ChaosEngine definition. It is intentional: this way, the operator will not delete the chaos job so that we can see what is happening:
$ kubectl -n nginx get po
NAME                                READY   STATUS      RESTARTS   AGE
nginx-chaos-runner                  0/1     Completed   0          4m28s
nginx-deployment-85ff79dd56-lq8r5   1/1     Running     0          32m
nginx-deployment-85ff79dd56-nt9n9   1/1     Running     0          3m3s
nginx-deployment-85ff79dd56-ptt54   1/1     Running     0          3m32s
Well, ChaosEngine brings in some of its buddies:
$ kubectl -n nginx get po
NAME                                READY   STATUS              RESTARTS   AGE
nginx-chaos-runner                  1/1     Running             0          15s
nginx-deployment-85ff79dd56-2kjgb   1/1     Running             0          2m18s
nginx-deployment-85ff79dd56-gmhn8   1/1     Running             0          2m34s
nginx-deployment-85ff79dd56-vt4jx   0/1     ContainerCreating   0          1s
nginx-deployment-85ff79dd56-wmfdx   1/1     Terminating         0          2m7s
pod-delete-vsxwf0-p9rt9             1/1     Running             0          7s

$ kubectl -n nginx get po
NAME                                READY   STATUS    RESTARTS   AGE
nginx-chaos-runner                  1/1     Running   0          87s
nginx-deployment-85ff79dd56-2kjgb   1/1     Running   0          3m30s
nginx-deployment-85ff79dd56-8nbll   1/1     Running   0          51s
nginx-deployment-85ff79dd56-gmhn8   1/1     Running   0          3m46s
pod-cpu-hog-lqds5k-d8hg6            1/1     Running   0          17s
The piece of logs of the CPU burner:
time="2020-11-09T19:48:06Z" level=info msg="[Chaos]:Number of pods targeted: 1"
time="2020-11-09T19:48:06Z" level=info msg="[Chaos]: The Target application details" container=nginx Pod=nginx-deployment-85ff79dd56-8nbll CPU CORE=4
time="2020-11-09T19:48:06Z" level=info msg="[Chaos]:Waiting for: 60s"
However, Prometheus shows that this “CPU hog” have not been able to “eat” the four cores as it was promised:
The reason for this remains unknown. Maybe, one day we’ll investigate this one or another implementation of the container chaos monkeys (by default, https://github.com/alexei-led/pumba is used)…
But let’s get back to our victim deployment:
$ kubectl -n nginx get po
NAME                                READY   STATUS    RESTARTS   AGE
nginx-chaos-runner                  1/1     Running   0          2m41s
nginx-deployment-85ff79dd56-2kjgb   1/1     Running   0          4m44s
nginx-deployment-85ff79dd56-8nbll   1/1     Running   0          2m5s
nginx-deployment-85ff79dd56-gmhn8   1/1     Running   0          5m
pod-memory-hog-r3ngl5-kjhl7         1/1     Running   0          5s
Here is the piece of logs of the “hog” that eats up memory:
time="2020-11-09T19:49:33Z" level=info msg="[Chaos]:Number of pods targeted: 1"
time="2020-11-09T19:49:33Z" level=info msg="[Chaos]: The Target application details" container=nginx Pod=nginx-deployment-85ff79dd56-8nbll Memory Consumption(MB)=500
time="2020-11-09T19:49:33Z" level=info msg="[Chaos]:Waiting for: 60s"
time="2020-11-09T19:49:33Z" level=info msg="The memory consumption is: 500"
The memory usage is in line with the expectations:
Our experiment is over:
$ kubectl -n nginx get po
NAME                                READY   STATUS      RESTARTS   AGE
nginx-chaos-runner                  0/1     Completed   0          4m20s
nginx-deployment-85ff79dd56-2kjgb   1/1     Running     0          6m23s
nginx-deployment-85ff79dd56-8nbll   1/1     Running     0          3m44s
nginx-deployment-85ff79dd56-gmhn8   1/1     Running     0          6m39s
And here are the official results of the “autopsy”:
$ kubectl -n nginx get chaosresults.litmuschaos.io
NAME                         AGE
nginx-chaos-pod-cpu-hog      8m48s
nginx-chaos-pod-delete       9m49s
nginx-chaos-pod-memory-hog   7m21s
The verdict for our example is “Pass”:
$ kubectl -n nginx get chaosresults.litmuschaos.io
NAME                         AGE
nginx-chaos-pod-cpu-hog      8m48s
nginx-chaos-pod-delete       9m49s
nginx-chaos-pod-memory-hog   7m21s
$ kubectl -n nginx describe chaosresults.litmuschaos.io nginx-chaos-pod-delete
Name:         nginx-chaos-pod-delete
Namespace:    nginx
Labels:       app.kubernetes.io/component=experiment-job
              app.kubernetes.io/part-of=litmus
              app.kubernetes.io/version=1.9.1
              chaosUID=26c21578-2470-4f08-957f-94267cadc4ff
              controller-uid=7ef7d1c0-79c8-4e21-acfc-711b6b83f918
              job-name=pod-delete-vsxwf0
              name=nginx-chaos-pod-delete
Annotations:
API Version:  litmuschaos.io/v1alpha1
Kind:         ChaosResult
Metadata:
  Creation Timestamp:  2020-11-09T19:47:01Z
  Generation:          2
  Resource Version:    17209743
  Self Link:           /apis/litmuschaos.io/v1alpha1/namespaces/nginx/chaosresults/nginx-chaos-pod-delete
  UID:                 8e60299b-1751-42a3-a22b-29f5a64d86b5
Spec:
  Engine:      nginx-chaos
  Experiment:  pod-delete
Status:
  Experimentstatus:
    Fail Step:  N/A
    Phase:      Completed
    Verdict:    Pass
Events:
  Type    Reason   Age    From                     Message
  ----    ------   ----   ----                     -------
  Normal  Awaited  10m    pod-delete-vsxwf0-p9rt9  experiment: pod-delete, Result: Awaited
  Normal  Pass     9m42s  pod-delete-vsxwf0-p9rt9  experiment: pod-delete, Result: Pass
For those who would like to see even more features, Litmus offers an excellent guide to monitoring chaos experiments using a full stack of Prometheus + Grafana with existing exporters and panels. If such a stack is already deployed in your cluster, you can add chaos monitoring to it (however, it will take some time and require some fine-tuning efforts).
Granted, Litmus is not the easiest tool to learn, but everything should work out if you carefully read the documentation. Litmus provides all the tools required for a complete victory of chaos over a cluster all the necessary tools for conducting full-scale chaos experiments. Moreover, the project provides detailed reports in the form of ChaosResults as well as in-depth logs that allow you to get insights into the results.
P.S. This project was the initiator of the recent emergence of the Kubernetes Chaos Engineering Meetup Group. Litmus is also on its way to the v2.0 release.
5. Chaos Toolkit
- GitHub: https://github.com/chaostoolkit/chaostoolkit/
- GitHub stars / contributors: ~1200 / 10+
- Written in: Python
This is a set of Python tools. You can use them to create an Open API for conducting chaos experiments. Chaos Toolkit has a large number of extensions for various providers and environments, including chaostoolkit-kubernetes that we are interested in (however, this project has significantly fewer GitHub stars: ~150).
You can deploy Chaos Toolkit Operator using Kubernetes manifests, which are to be applied via Kustomize (https://docs.chaostoolkit.org/deployment/k8s/operator/):
$ curl -s "https://raw.githubusercontent.com/kubernetes-sigs/kustomize/master/hack/install_kustomize.sh" | bash
$ ./kustomize build kubernetes-crd/manifests/overlays/generic-rbac | kubectl apply -f
The parent project has extensive documentation with examples (https://github.com/chaostoolkit/chaostoolkit-tutorials).
However, this is not a self-sufficient application for those who use Kubernetes (or any other infrastructure), but a set of tools for Python developers. It boasts a well-thought-out approach and a large number of features.
The project used to have an active ChaosHub repository. However, currently it is archived (https://github.com/chaostoolkit/chaoshub-archive):

6. KubeInvaders (and similar projects)
- GitHub: https://github.com/lucky-sideburn/KubeInvaders
- GitHub stars / contributors: ~700 / <10
- Written in: JavaScript
We conclude our review of chaos tools for Kubernetes with a very unusual tool — a game!
Download and install the chart (do not forget to specify the host for Ingress and whitelist containing the list of allowed namespaces).
$ git clone https://github.com/lucky-sideburn/KubeInvaders.git
$ kubectl create namespace kubeinvaders
$ helm install --set-string target_namespace="test-monkeys" --namespace kubeinvaders \
 --set ingress.hostName=invaders.kube.test.io --name kubeinvaders .
Now you can go to the mentioned URL to enjoy an impressive and fun way to kill pods:
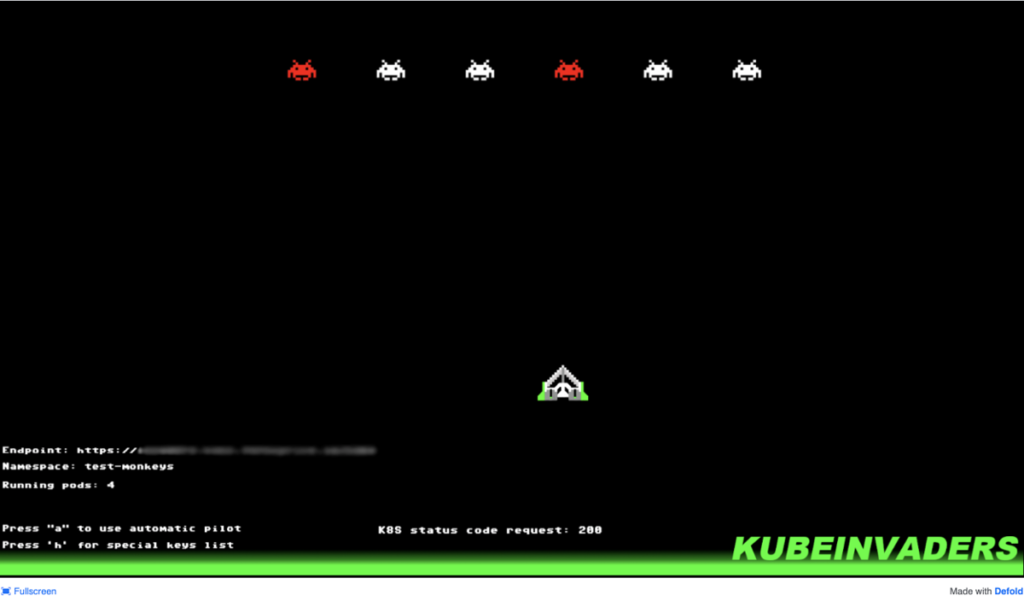
Yes! A legendary Space Invaders! We have to defeat space invaders (pods) to save the Earth! (Or, well, we can just test by killing pods manually or by turning on autopilot).
You can even increase the difficulty of the game:

The configuration is very simple and straightforward; there are clients for macOS and Linux available. The process itself is fun and exciting (even if the application is not very feature-rich).
But as it turns out, this isn’t the only way to make chaos engineering fun. Kube DOOM (~1300 GitHub stars) is even more popular among those who would like to “play chaos”. As the name suggests, here you kill pods using the good ol’ shooter game.

Finally, I would like to mention Cheeky Monkey to make the list of chaos games for Kubernetes more complete and diverse.
7. Other tools
Here are some other projects that were not included in the full review for various reasons:
- PowerfulSeal (~1600 stars on GitHub) is an advanced Python tool for injecting various problems into Kubernetes clusters. It has several operation modes for conducting chaos experiments. You can define YAML policies and conduct experiments automatically, or you can do it manually in “interactive” mode (by breaking everything and observing the consequences), or you can label pods that need to be killed. PowerfulSeal supports a variety of cloud providers (AWS, Azure, GCP, OpenStack) as well as local environments. In addition, it can export metrics to Prometheus and Datadog.
- Pod-reaper is a rule-based pod killer that uses the upstream cron library for running experiments. Use this advanced example to learn about its main features. Pod-reaper is written in Go. Note its repo wasn’t updated since November 2020.
- Kube-entropy is an application for testing web services in Kubernetes by monitoring changes in the HTTP status for selected ingresses. It is also written in Go and has not been updated since May 2020.
- Fabric8 Chaos Monkey is an implementation of chaos monkey for the Open Source microservice Fabric8 platform (it is based on Docker, Kubernetes, and Jenkins). You can install it right from the Fabric8’s interface.
- Kubernetes by Gremlin is a non-Open Source commercial service from renowned experts in the field of chaos engineering. It conducts a comprehensive audit of Kubernetes clusters for reliability and fault-tolerance. Also, there is a free plan available with limited functionality.
- Mangle by VMware is another Open Source tool for running chaos experiments against applications and infrastructure components. It can inject faults with a minimal pre-configuration and supports a bunch of various infrastructures (K8s, Docker, vCenter or any Remote Machine with ssh enabled).
Conclusion
Currently, there are plenty of tools to choose from for conducting chaos experiments in Kubernetes. You can use simple pod killers or opt for more advanced operators that readily provide a variety of ways to kill, crush, or wreak havoc on environments. There are even platforms for developers of custom chaos experiments. Everyone can find something to their liking.
I believe there are two main ways to use chaos engineering tools in K8s:
- You need to test an application in a specific namespace in an uncomplicated and controlled manner (while “hitting” infrastructure components sometimes). In this case, you can limit yourselves to some basic tooling — we would opt for kube-monkey that is best for such tasks.
- You need to thoroughly and continuously test the entire environment along with the infrastructure, and you are ready to spend time and resources on preparing and implementing the best option available. In this case, you can choose Chaos Mesh (a very simple-to-learn) or Litmus (more complex but just as convenient). Here you can also find our next article about Chaos Mesh.
Well, harm, kill, destroy, break, wreak havoc — do what it takes to make your applications and infrastructures resilient to any shocks and hardships!





Comments