Every now and then, we find ourselves in a situation where a cluster features many services interacting with each other. Unfortunately, these interactions are not properly documented due to the spontaneous nature of development. Neither development nor operation teams precisely know which applications and where they connect to, how frequently, and what load these connections create. So, when a problem occurs in some service’s performance, it’s unclear what to look for.
An automatically updating map of Kubernetes service interactions would come in handy in this case. You can build this kind of map using tools like Istio and Cilium, but there are also simpler solutions, such as NetFlow.
Searching for ready-made Open Source tools
Basically, Istio is a giant multitasking machine that takes care of an array of problems, such as service authorization and traffic encryption between services, request routing and balancing, tracing, etc.
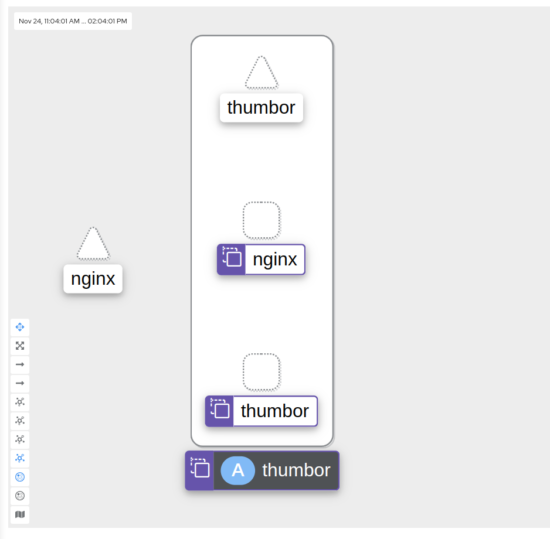
The downside of Istio is that it injects its sidecar containers via envoy proxies, meaning it essentially interferes with traffic taking place between applications. This may result in issues (you can solve them if you want to). Nevertheless, Istio is rarely used on a “plug and play” basis. There are always certain issues affecting the way the cluster operates. On top of that, each sidecar consumes CPU/memory resources and introduces additional, albeit minor, latencies.
We wanted some kind of cross-service monitoring system that wouldn’t interfere with the way applications interact with each other. So that if this system, say, malfunctions or fails to handle the traffic, that doesn’t affect those applications in any way.
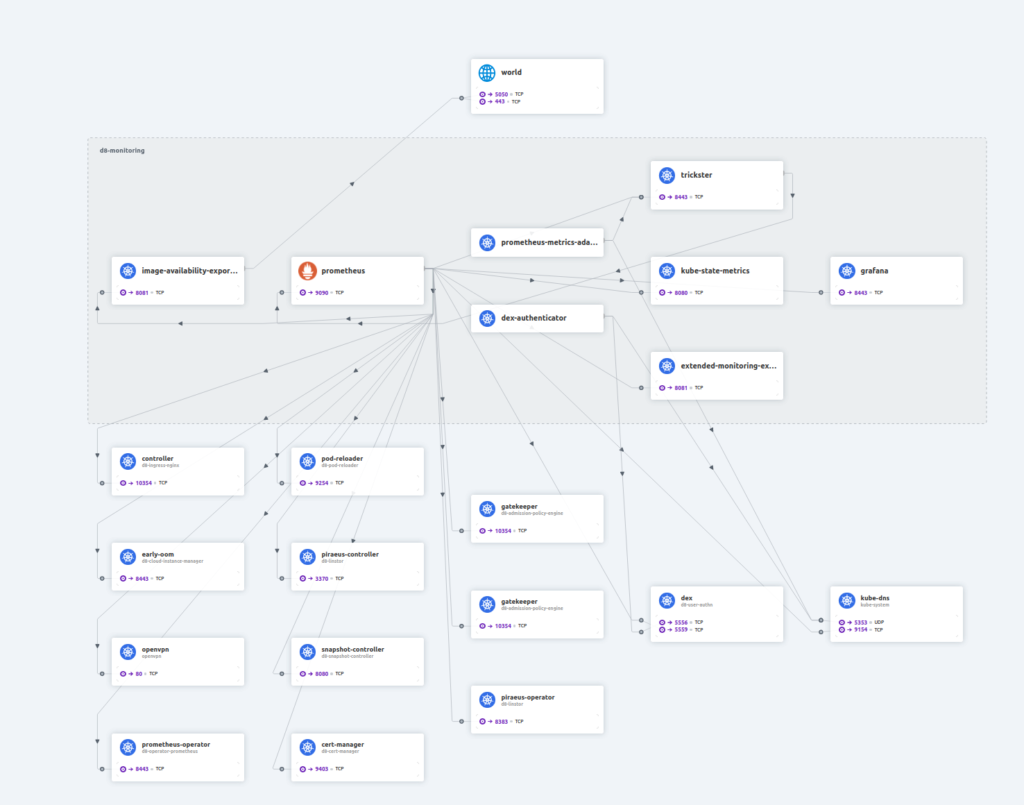
However, we could not find an Open Source tool that matched our requirements. Some CNIs provide this functionality, but only in part. For example, Cilium’s Hubble can display container interactions. But it consumes an enormous amount of computing resources and does not store the history — you can only see the interaction in the “here and now.”
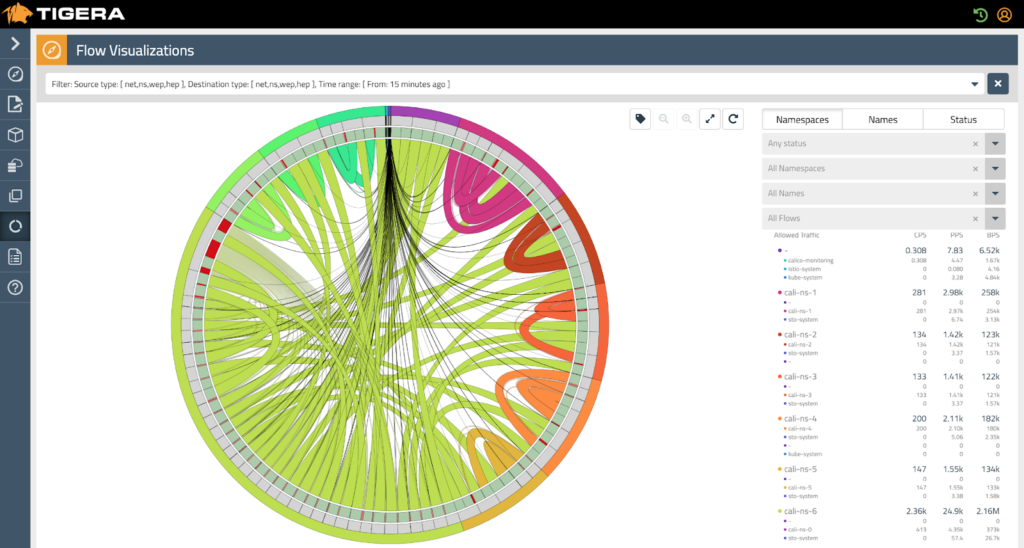
Calico has a similar feature, but it is only available in the enterprise edition.
In any case, we wanted to avoid being tied to the CNI and decided to favour a lightweight yet all-purpose tool. It had to be created, so here’s what we did.
Reinventing the wheel
The first thing we thought about was NetFlow and the ipt-netflow Linux kernel module. The latter monitors traffic and sends statistics via NetFlow to the collector in the Linux environment.
NetFlow is a network traffic collection protocol developed by Cisco Systems. Today it is the de-facto industry standard, supported by Cisco equipment and many other devices, including Open Source UNIX-like systems.
Since the module works at the kernel level, it can handle vast amounts of traffic (both PPS and BPS) with almost no contribution to the node load. For us, it appeared to be an excellent tool for capturing node traffic statistics.
Unfortunately, ipt-netflow only contains information about the source and destination IP addresses (and ports), so no data is available on the services, Pods, namespaces, and other Kubernetes entities. On top of that, we would have to figure out what to do with the massive amount of connection data the ipt-netflow sensors would send.
We thought about it for a long time and finally decided to “make a square peg work in a round hole.”
Basic implementation
Using the goflow2 library, we wrote our own NetFlow collector capable of exporting information on inter-service communication in Prometheus format:
- On startup, the collector subscribes via the Kubernetes API to information from all running, new, and deleted Pods. This allows it to track which IP address corresponds to which Pod or application (using labels) and in which namespace that application is running.
- Next, the collector parses NetFlow packets received from the ipt-netflow sensor by source and destination IP address, maps the addresses to the service names, and then updates Prometheus counters with the respective labels.
Regarding NetFlow stats, we were primarily interested in the bytes count per connection and the total number of connections. With these two numbers, you can estimate the number of ongoing requests from one service to another.
Thus, we collected the following two metrics: netflow_connection_count and netflow_connection_bytes. It is also possible to export netflow_connection_packets, but we have yet to find any practical use for this metric.
We ended up with something like this:
netflow_connection_count{dsthost="task-scheduler",dstnamespace="stage",srchost="kube-dns",srcnamespace="kube-system"} 5710
netflow_connection_count{dsthost="task-scheduler",dstnamespace="stage",srchost="opentelemetry-collector",srcnamespace="telemetry"} 11063
netflow_connection_bytes{dsthost="kube-dns",dstnamespace="kube-system",srchost="task-scheduler",srcnamespace="stage"} 1.126274e+06
netflow_connection_bytes{dsthost="opentelemetry-collector",dstnamespace="telemetry",srchost="task-scheduler",srcnamespace="stage"} 7.231581e+06
However, NetFlow stats do not reveal which application initiated the connection. That is, for each connection, you will have two entries in NetFlow stats — one for traffic from app A to app B and one for traffic from app B to app A.
Since NetFlow captures all traffic passing through the node, there is information about ingress as well as egress connections to the cluster. All connections from unknown IP addresses (those that do not belong to any Pod in the Kubernetes API) are labelled unknown*.
* Note: Some additional mapping can be done for these kinds of external addresses. For example, you can put an AS (Autonomous System) or AS Name in them. In this case, instead of unknown, the labels would have features like AS55023 or GOOGLE LLC.
Usage
We’ve been using Deckhouse Kubernetes Platform, so its NodeGroupConfiguration custom resource was helpful to propagate the ipt-netflow module to all cluster nodes.
apiVersion: deckhouse.io/v1alpha1
kind: NodeGroupConfiguration
metadata:
  name: iptnetflow.sh
spec:
  weight: 100
  bundles:
  - "*"
  nodeGroups:
  - "*"
  content: |
    dpkg -s iptables-netflow-dkms || ( apt-get update &&  apt-get install -y iptables-netflow-dkms )
    lsmod | grep ipt_NETFLOW || modprobe ipt_NETFLOW protocol=9
    [ "$(sysctl -n net.netflow.destination)" = 10.222.2.222:2055" ] || sysctl -w net.netflow.destination=10.222.2.222:2055
    [ "$(sysctl -n net.netflow.protocol)" = "9" ] || sysctl -w net.netflow.protocol=9
    iptables -C FORWARD -i cni0 -j NETFLOW || iptables -I FORWARD -i cni0 -j NETFLOW
As the description states, the custom resource:
- installs the
iptables-netflow-dkmspackage (Ubuntu version); - specifies the address to use for delivering NetFlow stats;
- selects the proper NetFlow version to use (
9); - forwards (using iptables) all packets from the
cni0interface to theNETFLOWchain, where the module will process them.
The cni0 interface may vary depending on the version of the CNI used.
It is important to note that only traffic entering the interface gets intercepted. Since the communicating applications are on different nodes, the traffic will be double-counted due to the fact that the sensor on each node will forward it to the collector.
Next, we ran our application and created a ClusterIP service for it with the address 10.222.2.222 listed in the manifest above:
apiVersion: v1
kind: Service
metadata:
  name: iptnetflow
  labels:
    prometheus.deckhouse.io/custom-target: iptnetflow
  annotations:
    prometheus.deckhouse.io/sample-limit: "30000"
spec:
  type: ClusterIP
  clusterIP: 10.222.2.222
  selector:
    app: iptnetflow
  ports:
    - name: udp-netflow
      port: 2055
      protocol: UDP
    - name: http-metrics
      port: 8080
      protocol: TCP
The service ingests a UDP stream from NetFlow on port 2055, processes it, generates metrics, and adds labels based on the Pods information received from the Kubernetes API. Finally, it exports the metrics on port 8080.
We also created a ServiceAccount with get watch list permissions for all Pods in the cluster.
At first, we thought of deploying a collector to each cluster node using a DaemonSet so that each node would send NetFlow stats to its respective collector. But it turned out that the NetFlow collector + Prometheus exporter bundle in a cluster of 60 nodes and 4,000+ Pods consumes less than 1 CPU. We even had to generate a higher flow rate to ensure that a single core would not become a bottleneck for the service in traffic processing.
Still, running a DaemonSet or Deployment in multiple replicas is possible if the cluster is huge and a single Pod will have a hard time handling the entire data flow. However, keep in mind that this will greatly increase the number of metrics being collected (and there are not many of them as it is), so you will have to aggregate them somehow.
The source code for the Go collector application and the Python converter service, as well as all the stuff needed to deploy them, are available in the repository.
You can run multiple collectors at different addresses to increase the system’s robustness. The ipt-netflow module can duplicate data to multiple targets — all you have to do is specify several destinations. Read more about this and many other module features in the official documentation.
Final touches
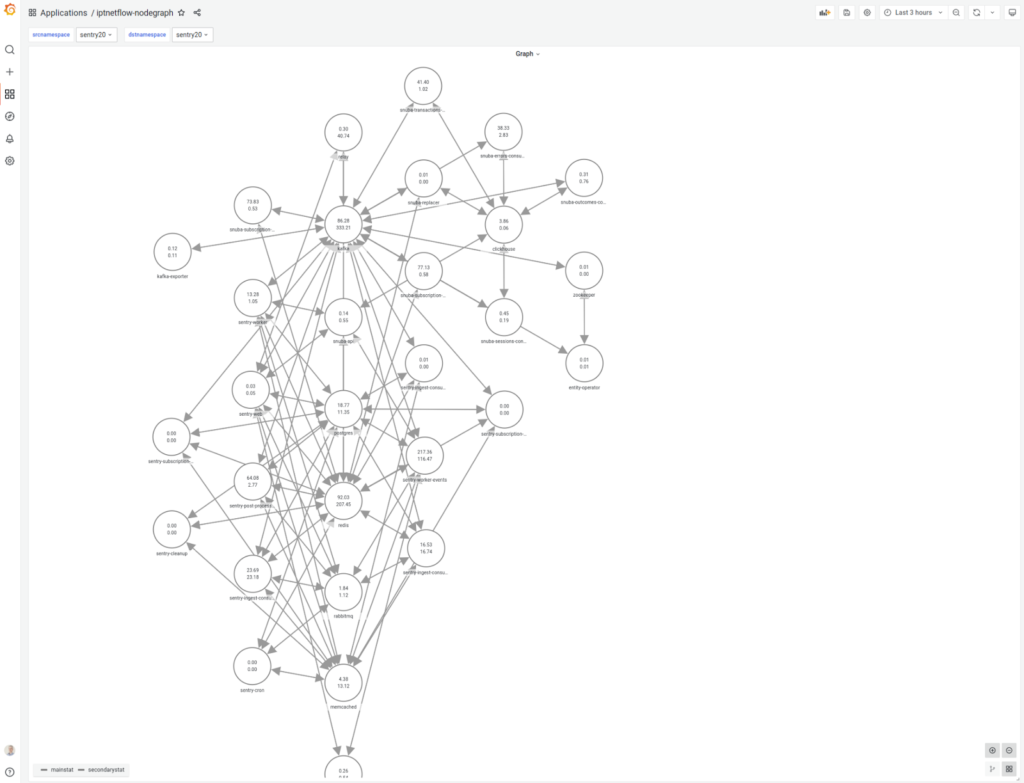
Our next step was to make a Grafana dashboard and a service interaction map using the hamedkarbasi93-nodegraphapi-datasource plugin.
We also wrote a basic Python application that uses ServiceAccount to get the data from Prometheus and outputs it in the format required by Nodegraph. Here goes its source code:
#!/usr/bin/env python

import json
import requests
from http.server import HTTPServer, BaseHTTPRequestHandler
from urllib.parse import urlparse, parse_qs
import time


class handler(BaseHTTPRequestHandler):
    def _set_headers(self):
        self.send_response(200)
        self.send_header("Content-type", "aplication/json")
        self.end_headers()

    def _fields(self):
        ret = '{"edges_fields": [{"field_name": "id","type": "string"},{"field_name": "source","type": "string"},{"field_name": "target","type": "string"}], "nodes_fields": [{"field_name": "id","type": "string"},{"field_name": "title","type": "string"},{"field_name": "mainStat","type": "number"},{"field_name": "secondaryStat","type": "number"}]}'
        return ret.encode("utf8")
    def _data(self):
        s = set()
        e = []

        with open('/var/run/secrets/kubernetes.io/serviceaccount/token', 'r') as file:
            auth_token = file.read().replace('\n', '')
        auth_headers = {'Authorization': 'Bearer ' + auth_token}
        print(self.path)
        req = urlparse(self.path)
        args = parse_qs(req.query)
        filter = []
        if 'srcnamespace' in args:
          filter.append('srcnamespace="' + args['srcnamespace'][0] + '"')
        if 'dstnamespace' in args:
          filter.append('dstnamespace="' + args['dstnamespace'][0] + '"')

        t_now = int( time.time() )
        t_from = int(int(args['from'][0])/1000)
        t_to   = int(int(args['to'][0])/1000)
        if t_to < t_now:
          offset = ' offset ' + str(t_now - t_to) + 's'
        else:
          offset = ''

        window = t_to - t_from
        if window < 60:
            window = 60


        params = [ ( 'query', 'sum by (dsthost,srchost) (rate(netflow_connection_bytes{' + ','.join(filter) + '}[' + str(window) + 's]' + offset +'))' ) ]
        url = 'https://prometheus.d8-monitoring.svc.cluster.local:9090/api/v1/query'
        resp = requests.get(url, verify=False, headers=auth_headers, params=params )
        bytes_in = {}
        bytes_out = {}
        data = resp.json()
        for i in data['data']['result']:
            tmp = {}
            tmp['source'] = i['metric']['srchost']
            tmp['target'] = i['metric']['dsthost']
            e.append(tmp)
            s.add(i['metric']['srchost'])
            s.add(i['metric']['dsthost'])

            if i['metric']['srchost'] not in bytes_out.keys():
                bytes_out[i['metric']['srchost']] = 0
            if i['metric']['dsthost'] not in bytes_in.keys():
                bytes_in[i['metric']['dsthost']] = 0
            if i['metric']['dsthost'] not in bytes_out.keys():
                bytes_out[i['metric']['dsthost']] = 0
            if i['metric']['srchost'] not in bytes_in.keys():
                bytes_in[i['metric']['srchost']] = 0

            bytes_out[i['metric']['srchost']] = bytes_out[i['metric']['srchost']]+ float(i['value'][1])
            bytes_in[i['metric']['dsthost']] = bytes_in[i['metric']['dsthost']] + float(i['value'][1])
        x = []
        for d in s:
            tmp ={}
            tmp['title']=d
            tmp['id']=d
            tmp['mainStat']=round(bytes_in[d]*8/1024/10.24)/100
            tmp['secondaryStat']=round(bytes_out[d]*8/1024/10.24)/100
            x.append(tmp)
        obj = {}
        obj['nodes'] = x
        obj['edges'] = e
        return json.dumps(obj).encode("utf8")


    def do_GET(self):
        self._set_headers()
        req = urlparse(self.path)
        if (req.path == "/api/graph/fields"):
            self.wfile.write(self._fields())
        elif (req.path == "/api/graph/data"):
            self.wfile.write(self._data())
        else:
            self.wfile.write('{"result":"ok"}'.encode("utf8"))


if __name__ == "__main__":

    server_class=HTTPServer
    addr="0.0.0.0"
    appport=5000
    server_address = (addr, appport)
    httpd = server_class(server_address, handler)
    print(f"Starting httpd server on {addr}:{appport}")
    httpd.serve_forever()
Results
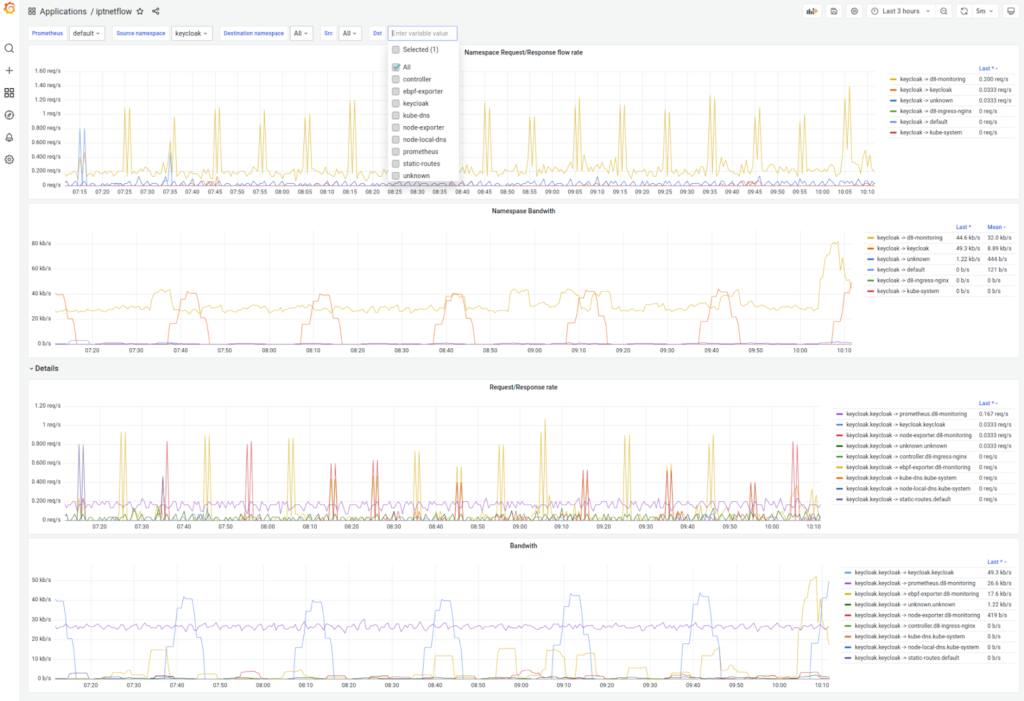
Finally, we had a lightweight tool to automatically build an interaction map between services in the Kubernetes cluster. Most importantly, it did not affect the performance of the services and did not interfere with traffic in any way.
It also allowed us to track the amount of data transferred between services and the number of open connections, giving a rough idea of the number of requests to the service.
This is the visual outcome of our efforts:
P.S.
If we had a similar task today, we would probably opt Coroot. However, it was more than one year ago we needed it, and there was no such option available at that moment. The tool we described in this article has been serving our needs perfectly during all this time; thus, we don’t a strong reason to change it now. Obviously, it might be slightly different reasoning for a fresh start. UPDATE (July 2023): Learn more about Coroot from our new article, where we install it in Kubernetes and examine its features.


Comments