

The Elastic stack (its two varieties – ELK and EFK, to be more precise) is one of the most popular solutions for log collection. The first variety includes Elasticsearch, Logstash, Kibana (and Beats, which is not part of the acronym; even the creators themselves joke about it: “Do we call it BELK? BLEK? ELKB?”). The second variety includes Elasticsearch, Fluentd, and Kibana (this time, no jokes). Each item in these stacks has its own role. Failure of one of the components often disrupts the smooth operation of all the others. This article discusses the ELK stack, namely, Logstash and Elasticsearch.
Note that this article is not intended to be a comprehensive guide on installing and configuring these components. Instead, it is an overview of some useful features as well as a checklist for dealing with some not-so-obvious things to minimize the loss of messages passing through ELK. It’s also worth mentioning that this article will not cover log collectors (which supply messages to Logstash) due to their great diversity. In other words, only the core components will be discussed.
Logstash
Generally, Logstash acts as an intermediary for messages, a transfer zone. It stores these messages in RAM, which is efficient in terms of processing speeds, but there is a risk of losing them if Logstash gets restarted. Another potential scenario is that so many messages accumulate in the queue (e.g., due to the Elasticsearch restart) that Logstash exceeds its memory limit, gets OOM-killed, and restarts completely empty.
Persistent queues
Persistent queues (learn more) are good if you need to ensure the preservation of critical messages — e.g., if Logstash acts as a consumer for some message broker. Another case is when some possibly lengthy downtime is involved — e.g., due to maintenance on the storage part (usually, it’s Elasticsearch). This Logstash feature will store message queues on a disk.
Unfortunately, this method may lead to some problems, such as a slight performance degradation (fortunately, this one is flexibly configurable) and the chance to get duplicate messages after an ungraceful Logstash shutdown (SIGKILL). In addition, you must monitor disk space and create a dedicated PV for queues if Logstash runs in a Kubernetes cluster. The path to the queue directory can be set by the path.queue variable (the default one is path_to_data/data/queue).
Pay attention to the queue.checkpoint.writes parameter while configuring the persistent queue. Basically, it defines how often fsync is invoked and the queue is written to disk. The default is 1024 events. You can set this parameter to 1 to ensure maximum durability and avoid losing data in the persistent queue. However, doing this can severely impact performance.
The queue.max_bytes parameter is also worth paying attention to. Its default value is 1024 MB (1 GB). Reaching the size limit (i.e., the queue is full of unACKed events), Logstash stops accepting new events until filtering and output stages finish processing existing events in the queue. Note that the capacity of your volume must be greater than the value you specify here. Suppose your PV is 4 GB, then you have to adjust the queue size correspondingly.
Alternatively, the queue.max_events sets the maximum number of events in the queue (the default is 0 — unlimited). It does the same thing as the max_bytes parameter, only in a slightly different way. If both queue.max_events and queue.max_bytes are specified, Logstash uses whichever criteria is reached first.
Note that the persistent queue’s data consists of files called “pages”. When a page hits a particular size defined by the queue.page_capacity parameter (the default is 64 MB), it becomes immutable (no writing is allowed) and waits until its events are ACKed. Then Logstash creates a new page and appends new events to it until this page reaches queue.page_capacity. Each page stores multiple events. The page can only be deleted from the disk if all its events are ACKed (otherwise, it stays on the disk and occupies queue.max_bytes). That’s why setting a large value for queue.page_capacity is not recommended.
Let’s sum up what we’ve learned so far. Persistent queues are great if you need to minimize data loss/improve durability. However, we advise you to test persistent queues before using them in a production environment since saving messages to a hard drive (instead of RAM) can lead to a performance loss. You can use this benchmark (from the official Elastic blog) to measure the persistent queue performance impact.
Dead letter queues
Since we are talking about persistent queues, it is worth saying a few words about the so-called dead letter queues (learn more). This queue is designed for events that cannot be processed (say, the data contains a mapping error or some other issue). Oftentimes, there are more of them than you expect. But let’s start from its limitations:
- Currently, DLQs can only process messages that were initially supposed to end in Elasticsearch. In other words, Logstash writes to the DLQ only the unsuccessful events with Elasticsearch set as an output.
- These messages are written locally, as files to a disk. Logstash can send the messages to Elasticsearch using the dead_letter_queue input plugin, however, the files will still persist on the disk even after they are sent.
The DLQ works as follows: Elasticsearch may refuse to accept the Logstash-sourced message if its structure differs significantly from the one Elasticsearch expects to see. In this case, Logstash will discard this message to avoid blocking the pipeline. However, if the DLQ is enabled, Logstash will save the rejected messages into files at path_to_data/data/dead_letter_queue/pipeline_name.
When Logstash is started (with DLQ enabled), we can find two files in its directory, 1.log.tmp and .lock. The *.tmp file is the one currently used for messages to be written.
The DLQ has relatively few settings. The dead_letter_queue.flush_interval parameter defines the period after which the temporary file (used for writing events) is renamed to a DLQ segment file for further processing (and a new tmp file is created). This parameter defaults to 5000 ms (note that this value cannot be lower than 1000 ms). Initially, an empty 1.log.tmp file is created. Later, this file will be renamed to 1.log (and become immutable), and 2.log.tmp will be created if dead_letter_queue.flush_interval has elapsed since the event was written to a temporary file (supposing it has some entries already since Logstash does not rotate empty files).
The second parameter is dead_letter_queue.max_bytes. It sets the maximum size of the DLQ that can be stored on a disk. When the file size (for 1.log, 2.log, etc.) reaches this pre-configured threshold, Logstash automatically creates a new file.
To process events in the dead letter queue, you have to create a pipeline (in this case, the dead_letter_queue input plugin reads DLQ entries). Suppose there is the main pipeline that supplies messages to Elasticsearch, and we need to configure the DLQ for it:
- Create a new pipeline called
dead-letter-queue-main.conf:
   input {
     dead_letter_queue {
       path => "/usr/share/logstash/data/dead_letter_queue"
       commit_offsets => true
       pipeline_id => "main"
     }
   }
   output {
     elasticsearch {
       hosts => [ "{{ .Values.elasticsearch.host }}:{{ .Values.elasticsearch.port }}" ]
       index => "logstash-dlq-%{+YYYY.MM.dd}"
     }
   }
Here, the input field contains the path to the directory where DLQ messages are stored. The pipeline_id refers to the main (target) pipeline. You can read more about the plugin configuration in the documentation.
- Enable the DLQ. For this, enable the DLQ for the
mainpipeline inpipelines.ymland adddead-letter-queue-main.confto the list of pipelines:
    - pipeline.id: main
      path.config: "/usr/share/logstash/pipeline/pipeline-main.conf"
      dead_letter_queue.enable: true
      dead_letter_queue.max_bytes: 1024mb
      dead_letter_queue.flush_interval: 5000
    - pipeline.id: main-dlq
      path.config: "/usr/share/logstash/pipeline/dead-letter-queue-main.conf"
In our example, the DLQ is enabled for the main pipeline only. Insert these settings directly in logstash.yaml instead of pipelines.yml to activate DLQs for all Logstash pipelines. Similarly, you can enable a persistent queue for a specific pipeline.
Also, we use the default values for max_bytes and flush_interval parameters. Note that the DLQ pipeline cannot process messages (supply them to Elasticsearch) in the *.log.tmp file until it is renamed to a DLQ segment file (*.log) and a new *.log.tmp file is created. That is why setting too high values for the dead_letter_queue.flush_interval parameter is not recommended.
Currently, Logstash does not collect garbage, i.e. doesn’t delete old DLQ contents on the disk (this feature has not yet been implemented). There are several workarounds to this problem, but none of them is “official.”
DLQs come in handy if you notice that some messages do not end up in Elasticsearch or if you want to protect yourself from potential problems (which may arise if the message structure changes and Elasticsearch no longer can process them). However, keep in mind that this feature is not yet perfected, and you have to work out by yourself some of its aspects (e.g., deleting DLQs from a disk).
Elasticsearch
Elasticsearch can be called the system’s heart since it stores and processes our messages. In this part, I would like to discuss a few things that allow you to monitor Elasticsearch’s health.
Monitoring
X-Pack is an Elastic Stack extension that provides a lot of additional functionality, both fee-based and free. Starting with version 6.3, free X-Pack features are integrated into regular Stack builds (the basic version is enabled by default).
The complete list of X-Pack features is available on Elastic’s website. The BASIC — FREE AND OPEN column lists free features.
NB. No prices are publicly available for paid subscriptions since they might vary a lot as they depend on the resources involved. The pricing page does not offer specific estimates for self-managed solutions; instead, it invites anyone interested to contact the company.
Now, let’s get back to the free version. It has some features enabled by default, while others you have to turn on manually.
Monitoring is enabled by default, while data collection is not. Access to many detailed graphs with information about cluster nodes and indices can be obtained by adding xpack.monitoring.collection.enabled: true to the elasticsearch.yml file. You can browse them at http://kibana_address/app/monitoring. Below are some telling examples:
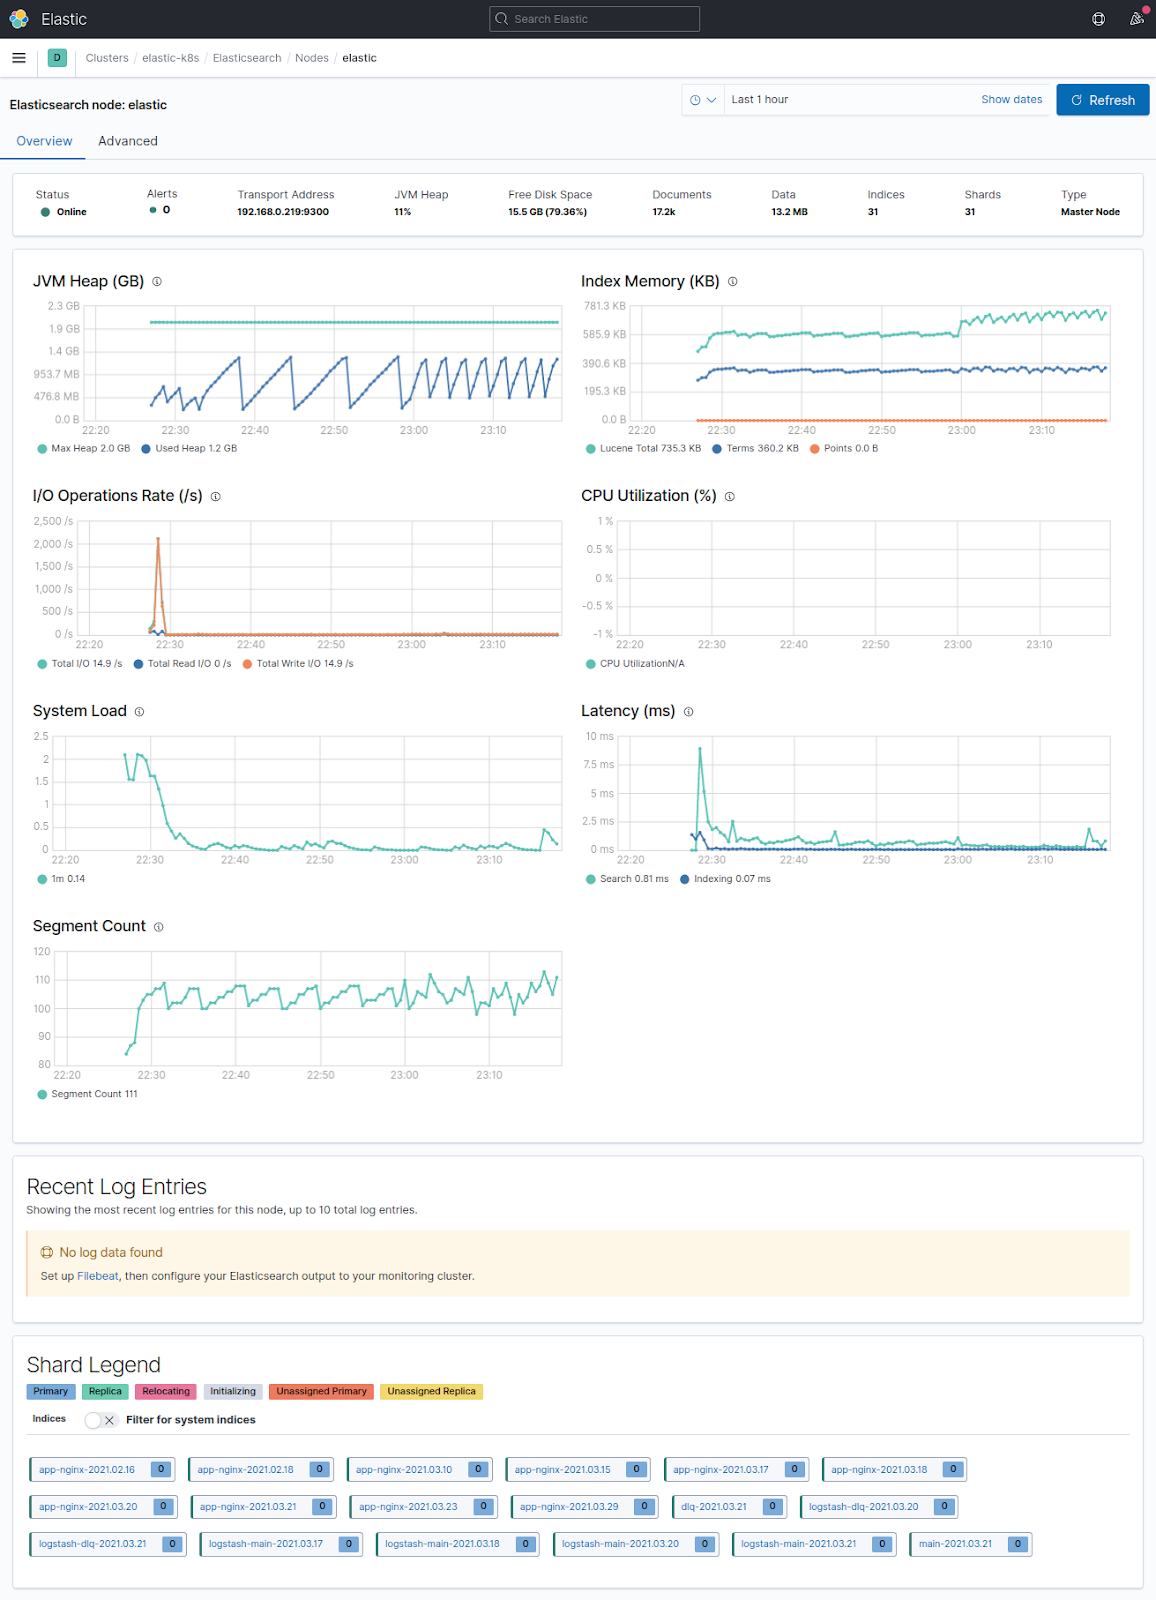

Elasticsearch has some ready-made indices that let you monitor the process if the data collection is enabled. For example, in the case of Elasticsearch itself, there is a .monitoring-es-7-%{+YYYY.MM.dd} index. Here you can find information about all monitoring settings available in Elasticsearch.
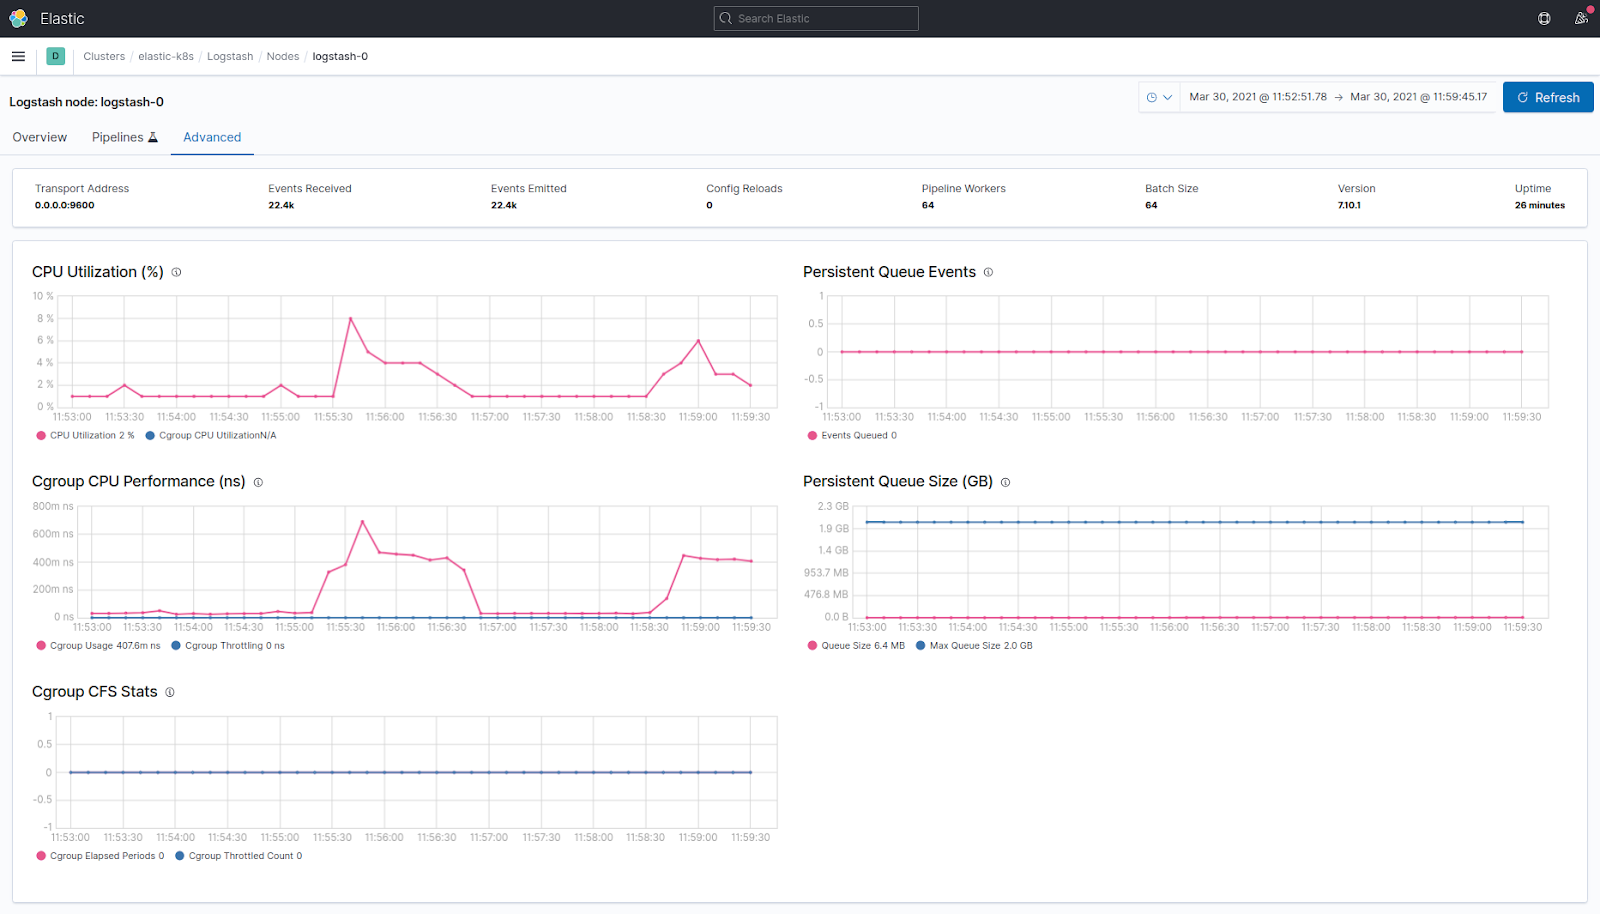
Similarly, you can enable Logstash monitoring by adding xpack.monitoring.enabled: true and xpack.monitoring.elasticsearch.hosts: "elastic_address:9200" to the config file (please note that this method is considered legacy starting with version 7.9.0 released in August 2020).
You can also configure authorization for the cluster, including Kibana’s authorization. To do this, refer to the “Security” section of the documentation. Even the free X-Pack version provides many fascinating features. However, in some cases, particular functions of the free feature are not available for the basic license.
A good example of this is the Elasticsearch monitoring mentioned above that uses .monitoring-es-7-%{+YYYY.MM.dd}-like indices. The xpack.monitoring.history.duration parameter controls the deletion of these indices. However, under the basic license, the default value cannot be changed.
The X-Pack provides a nice-looking informative dashboard with graphs. However, you should not entirely rely on it since Elasticsearch monitoring data is stored in indices kept in that very same Elasticsearch cluster. This is the reason the system does not seem reliable (and it is not reliable if your Elasticsearch cluster has just one node).
That is why the official documentation states that the proper way to implement monitoring in the production environment is to create a dedicated cluster for monitoring needs. To monitor the node properly, you have to configure an Elasticsearch exporter (for monitoring cluster/node health, unassigned shards, etc.) and an exporter for the virtual machine to monitor its load and free disk space. Thus, it seems to be a perfect time to say a few words about the watermark…
Watermarks
Elasticsearch uses the so-called watermarks to allocate shards on nodes. These thresholds help the allocator determine whether it is time to move some of the shards onto other nodes in the cluster. Three scenarios are possible depending on disk space used:
- low — if some node has exceeded the low watermark, no new shards can be allocated onto it. The
cluster.routing.allocation.disk.watermark.lowparameter sets the value of the low watermark (the default one is 85%). This parameter does not affect the primary shards of newly created indices (meaning that they will be allocated, while their copies will not); - high — if some node has exceeded the high watermark, Elasticserach attempts to relocate shards away from this node. The
cluster.routing.allocation.disk.watermark.highparameter sets the value of the high watermark (the default one is 90%). - flood_stage — if some node has exceeded this threshold, Elasticsearch enforces a
read_only_allow_deleteblock for every index with shards on the node in question. You can configure theflood_stagewatermark using thecluster.routing.allocation.disk.watermark.flood_stageparameter (the default value is 95%).
The flood_stage option can be troublesome given that the read_only_allow_delete block only allows deleting the index (deleting documents from the index is prohibited).
Usually, indices are evenly distributed among the nodes, and read_only_allow_delete blocks are quite rare. This kind of scenario is possible if you use a regular index template with number_of_shards = 1, while the index turns out to be huge (e.g., some massive Java trace is being logged). In this case, if this shard exceeds the high watermark, Elasticsearch will try to relocate it to another node, but the poor shard will not stay there for long either.
To avoid this, you have to set up a template with the reasonable number_of_shards for such indices to distribute these shards between the nodes evenly. This number_of_replicas is another parameter to keep in mind. If you only have a single-node cluster, set this parameter to 0; otherwise, the Elasticsearch status will not be shown in green due to unassigned_shards.
You can edit index settings or create templates using curl requests to the Elasticsearch API (see below) or via a dedicated Cerebro UI.
You should take into account the watermark parameters when configuring monitoring of the host where the Elasticsearch node is running. Note that you can also use absolute byte values for watermarks instead of percentage ones. This comes in handy in the case of large disks. Note that byte values refer to free disk space. It is counter-intuitive, but the byte value for the low watermark must be higher than that of the high watermark, i.e. low > high > flood stage.
Elasticsearch API cheat sheet
Below is a cheat sheet for the Elasticsearch API – a list of the most frequently used commands. We assume that the Elasticsearch address is passed to the NODE_IP environment variable. You can define it using the following command:
NODE_IP=$(netstat -tulnp |grep 9200 |awk '{print $4}') && echo $NODE_IP… or assign it manually: NODE_IP="elastic_node_ip:9200"
General commands
- Find out the Elasticsearch version:
curl -s -X GET "$NODE_IP"- Check the cluster health. The green status indicates that everything is fine. Otherwise, most likely, there are some unassigned shards:
curl -s -X GET "$NODE_IP/_cluster/health?pretty"- Check the node health:
curl -s -X GET "$NODE_IP/_nodes/stats?pretty" | head -6- View the list of nodes, their roles, and their load:
curl -s -X GET "$NODE_IP/_cat/nodes?v=true"In the node.role field, you can see a bunch of letters. Here is how you can decipher them:
- Master eligible node (
m); - Data node (
d); - Ingest node (
i); - Coordinating node only (
-).
- Get stats on disk space used on nodes and the number of shards on each node:
curl -s -X GET "$NODE_IP/_cat/allocation?v"- View the list of plugins:
curl -s -X GET "$NODE_IP/_cat/plugins?v=true&s=component&h=name,component,version,description"- View the cluster settings (including default ones):
curl -s -X GET "$NODE_IP/_all/_settings?pretty&include_defaults=true"- Check watermark values:
curl -s -X GET "$NODE_IP/_cluster/settings?pretty&include_defaults=true" | grep watermark -A5or:
curl -s -X GET "$NODE_IP/_cluster/settings?pretty&include_defaults=true" | jq .defaults.cluster.routing.allocation.disk.watermarkIndices, Shards
- View the index list:
curl -s -X GET "$NODE_IP/_cat/indices"- Sort the index list by size:
curl -s -X GET "$NODE_IP/_cat/indices?pretty&s=store.size"- View the index settings:
curl -s -X GET "$NODE_IP/<index_name>/_settings?pretty"- Remove the read-only attribute from an index:
curl -X PUT "$NODE_IP/<index_name>/_settings?pretty" -H 'Content-Type: application/json' -d'
{
   "index": {
        "blocks": {
            "read_only_allow_delete": "false"
        }
    }
}'- Get a list of shards:
curl -X GET "$NODE_IP/_cat/shards?pretty"- Get a list of unassigned shards:
curl -s -X GET $NODE_IP/_cat/shards?h=index,shard,prirep,state,unassigned.reason| grep UNASSIGNED- Get an explanation of why shards are not allocated:
curl -s $NODE_IP/_cluster/allocation/explain | jq- Delete a replica shard for an index:
curl -X PUT "$NODE_IP/<index_name>/_settings" -H 'Content-Type: application/json' -d'
{
  "index" : {
    "number_of_replicas" : 0
  }
}'- Delete an index/shard:
curl -X DELETE $NODE_IP/<name>Templates
- Get a list of templates:
curl -s -X GET "$NODE_IP/_cat/templates?pretty"- View the template settings:
curl -X GET "$NODE_IP/_index_template/<template_name>?pretty"- How to create a template (example):
curl -X PUT "$NODE_IP/_index_template/<template_name>" -H 'Content-Type: application/json' -d'
{
    "index_patterns": ["<index_name>-*"],
    "template": {
        "settings": {
            "number_of_shards": 1,
            "number_of_replicas": 0
       }
    }
}'- Delete a template:
curl -X DELETE "$NODE_IP/_index_template/<template_name>?pretty"Conclusion
Logstash serves as a processing intermediary that ingests data, filters it, and sends it to your preferred output. Persistent and dead letter queues increase Logstash processing efficiency while leading to some performance degradation (as in the first case) and the need to implement some workarounds due to limited functionality (as in the second case).
Elasticsearch is the core of our system. You have to monitor its state regardless of whether it is primarily involved in log collecting or log searching. Even the basic (and free) X-Pack version provides a handy set of tools for collecting statistics about indices and node states. You should also pay attention to watermarks: they often get overlooked when alerts are being set up.

Comments