This article documents our experience dealing with the problem of multiple requests being sent to the Kubernetes API server from one of the cluster applications.
A bit of background
It was a peaceful, relaxed evening. Suddenly, after one ordinary and fairly unremarkable kube-apiserver reboot, etcd memory consumption shot up almost threefold. Explosive growth led to a cascading restart of all the master nodes. Leaving a customer’s production cluster in such peril was not an option.
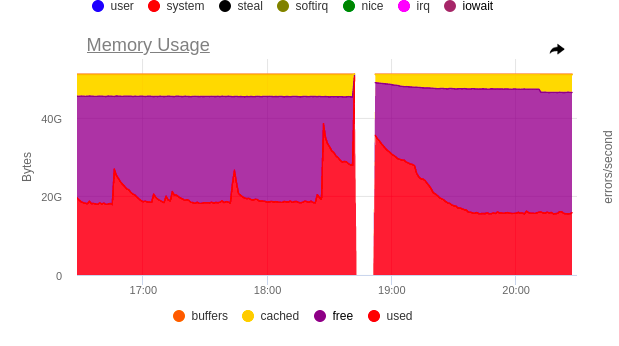
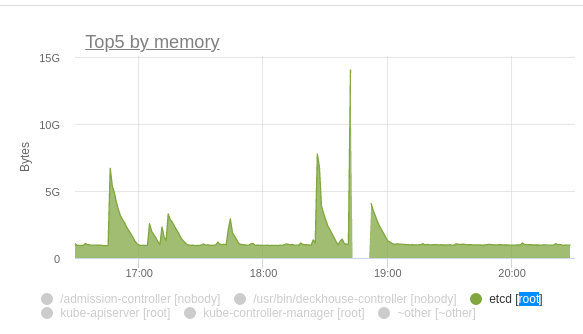
After studying audit logs, we realised that one of our DaemonSets was to blame. Once we’d restart kube-apiserver, its pods would be sending new list requests to populate their caches with objects (such behaviour is default for Kubernetes client-go infromers).
To give you an idea of the scale of the issue, let’s just say that each pod made 60 list queries upon startup while there were ~80 nodes in the cluster.
What’s wrong with etcd?
Here we come to the point
Our application’s pods sent out requests that looked like the following:
/api/v1/pods?fieldSelector=spec.nodeName=$NODE_NAMELet me put that into human language: ‘show me all the pods that are on the same node as me‘. At first glance, the number of objects returned must not exceed 110, but for etcd this is not quite the case.
{
  "level": "warn",
  "ts": "2023-03-23T16:52:48.646Z",
  "caller": "etcdserver/util.go:166",
  "msg": "apply request took too long",
  "took": "130.768157ms",
  "expected-duration": "100ms",
  "prefix": "read-only range ",
  "request": "key:\"/registry/pods/\" range_end:\"/registry/pods0\" ",
  "response": "range_response_count:7130 size:13313287"
}
As you can see above, range_response_count is 7130 instead of 110! Why is that? etcd is a pretty basic database that stores all the data in a key-value format, while all the keys are generated using the /registry/<kind>/<namespace>/<name> pattern. So the database is unaware of any field or label selectors. Consequently, to return 110 pods we need, kube-apiserver must retrieve ALL the pods from etcd.
At that point, it became clear that despite the efficient requests to the kube-apiserver, the applications were still producing a huge load on etcd. That led us to wonder, “Is there any way to avoid making requests to the database?”
Resource version
The first method we thought of was to specify resourceVersion as the request parameter. Each object in Kubernetes has a version that is incremented each time the object is modified. So we took advantage of that property.
In fact, there are two parameters: resourceVersion and resourceVersionMatch. Refer to the Kubernetes documentation for details on how to use them. Now, let’s see what version of the object we may end up with.
- The most recent version (
MostRecent) is the default one. If no other options are specified, the most recent version of the object is retrieved. To make sure it is the most recent version, the request must IN ALL CASES be sent to etcd. Anyversion requested that is no older than0will return the version that is in the kube-apiserver cache. In this case, we will only have to turn to etcd when the cache is empty. A point to note: if you have more than one kube-apiserver instance, there is a risk of fetching divergent data when making requests to different kube-apiserver instances.- A not older than (
NotOlderThan) version requires a specific version to be specified, so we cannot use that during the application startup. The request ends up in etcd in the event that no matching version is in the cache. Exactis the same asNotOlderThan, except that requests end up in etcd more often.

If your controller needs the received data to be accurate, the default setting (MostRecent) is what the doctor ordered. However, for some components, e.g., a monitoring system, no extreme accuracy is required. The kube-state-metrics has a similar option.
Well, it looks like we’ve found a solution. Let’s test it out:
# kubectl get  --raw '/api/v1/pods' -v=7 2>&1 | grep 'Response Status'
I0323 21:17:09.601002  160757 round_trippers.go:457] Response Status: 200 OK in 337 milliseconds

# kubectl get  --raw '/api/v1/pods?resourceVersion=0&resourceVersionMatch=NotOlderThan' -v=7 2>&1 | grep 'Response Status'
I0323 21:17:11.630144  160944 round_trippers.go:457] Response Status: 200 OK in 117 milliseconds
There is only one request in etcd that runs for 100 milliseconds.
{
  "level": "warn",
  "ts": "2023-03-23T21:17:09.846Z",
  "caller": "etcdserver/util.go:166",
  "msg": "apply request took too long",
  "took": "130.768157ms",
  "expected-duration": "100ms",
  "prefix": "read-only range ",
  "request": "key:\"/registry/pods/\" range_end:\"/registry/pods0\" ",
  "response": "range_response_count:7130 size:13313287"
}
It works! But what could possibly go wrong? Our application was written in Rust, and there was simply no resource version setting in the Kubernetes Rust library!
So we got a little frustrated, made a note to open a pull request with the desired functionality for that library, and went on searching for another solution (by the way, we did submit a pull request).
Slowing down to speed up
But there was another thing that caught our eye: consecutive redeployment of the pods had no effect on the consumption graphs. All that was shown on them was simultaneous redeployment. What if we could somehow queue up all the kube-apiserver requests and thus prevent our applications from killing it? That’s doable, isn’t it?

In our case, we leveraged the Priority & Fairness API. You can read more about it in the documentation. But we didn’t have time to do any reading or reflecting, as we had an incident to fix. We focused on the most important thing: how to queue up all the requests.
First, we created two manifests:
apiVersion: flowcontrol.apiserver.k8s.io/v1beta1
kind: PriorityLevelConfiguration
metadata:
  name: limit-list-custom
spec:
  type: Limited
  limited:
    assuredConcurrencyShares: 5
    limitResponse:
      queuing:
        handSize: 4
        queueLengthLimit: 50
        queues: 16
      type: Queue
PriorityLevelConfiguration is otherwise known as “queue settings”. We used the standard ones (by copying them from the documentation). The main challenge here was to figure out how many parallel requests we had available since the settings for one queue affect the other queues. (To find this out, you can apply a resource or do some complex mathematical calculations in your mind.)
apiVersion: flowcontrol.apiserver.k8s.io/v1beta1
kind: FlowSchema
metadata:
  name: limit-list-custom
spec:
  priorityLevelConfiguration:
    name: limit-list-custom
  distinguisherMethod:
    type: ByUser
  rules:
  - resourceRules:
    - apiGroups: [""]
      clusterScope: true
      namespaces: ["*"]
      resources: ["pods"]
      verbs: ["list", "get"]
    subjects:
    - kind: ServiceAccount
      serviceAccount:
        name: ***
        namespace: ***
The FlowSchema answers questions like What? From what? Where?, or which resource requests to send to which resources in which order.
We applied both settings hoping to see the improvement and took a look at the charts.
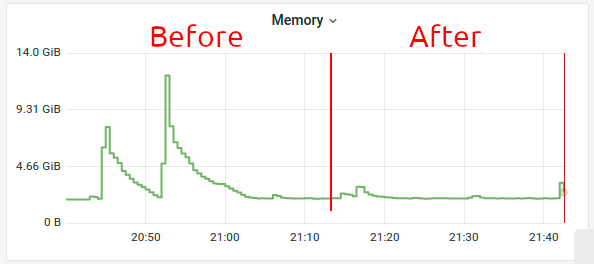
Great! There were still some spikes left, but the charts were mostly OK. The incident has been resolved and its criticality has been lowered.
Afterword
It turned out the culprit was a vector log collector DaemonSet which used pod data to enrich the logs with meta-information. We opened the PR to address this problem.
However, not only pod requests were potentially dangerous. We discovered a similar problem with the Cilium CNI and solved it in the tried-and-true way described here.
Such quirks are common with Kubernetes. One good way of dealing with them is to use a platform where these and many other cases are handled out of the box.


Comments