When diagnosing issues in the Kubernetes cluster, we often notice flickering* of one of the cluster nodes, which usually happens in a random and strange manner. That’s why we have been experiencing a need in a tool that can test the reachability of one node from another and present results in the form of Prometheus metrics. Having that, we would also want to create graphs in Grafana and quickly locate the failed node (and — if necessary — to reschedule all pods from it and conduct the required maintenance).
* By “flickering” I mean some sort of behavior when a node randomly becomes NotReady and later turns back to work. Or, for example, part of the traffic may not reach pods on neighboring nodes.
Why do such situations take place at all? One of the common causes is the connectivity issues at the switch in the data center. For example, while we have been setting up a vswitch in Hetzner once, one of the nodes has become unavailable through this vswitch-port and happened to be completely unreachable on the local network.
Our last requirement was to run this service directly in Kubernetes, so we would be able to deploy everything via Helm charts. (In the case of, say, Ansible we would have to define roles for each of the various environments: AWS, GCE, bare metal, etc.) Since we haven’t found a ready-made solution for this, we’ve decided to implement our own.
Script and configs
The main component of our solution is a script that watches the .status.addresses value for each node. If this value has changed for some node (i.e., the new node has been added), our script passes the list of nodes in the form of ConfigMap to a chart via Helm values:
---
apiVersion: v1
kind: ConfigMap
metadata:
  name: node-ping-config
  namespace: kube-prometheus
data:
  nodes.json: >
    {{ .Values.nodePing.nodes | toJson }}
That’s the Python script itself:
#!/usr/bin/env python3

import subprocess
import prometheus_client
import re
import statistics
import os
import json
import glob
import better_exchook
import datetime

better_exchook.install()

FPING_CMDLINE = "/usr/sbin/fping -p 1000 -A -C 30 -B 1 -q -r 1".split(" ")
FPING_REGEX = re.compile(r"^(\S*)\s*: (.*)$", re.MULTILINE)
CONFIG_PATH = "/config/nodes.json"

registry = prometheus_client.CollectorRegistry()

prometheus_exceptions_counter = \
    prometheus_client.Counter('kube_node_ping_exceptions', 'Total number of exceptions', [], registry=registry)

prom_metrics = {"sent": prometheus_client.Counter('kube_node_ping_packets_sent_total',
                                                  'ICMP packets sent',
                                                  ['destination_node',
                                                   'destination_node_ip_address'],
                                                  registry=registry), "received": prometheus_client.Counter(
    'kube_node_ping_packets_received_total', 'ICMP packets received',
    ['destination_node', 'destination_node_ip_address'], registry=registry), "rtt": prometheus_client.Counter(
    'kube_node_ping_rtt_milliseconds_total', 'round-trip time',
    ['destination_node', 'destination_node_ip_address'], registry=registry),
                "min": prometheus_client.Gauge('kube_node_ping_rtt_min', 'minimum round-trip time',
                                               ['destination_node', 'destination_node_ip_address'],
                                               registry=registry),
                "max": prometheus_client.Gauge('kube_node_ping_rtt_max', 'maximum round-trip time',
                                               ['destination_node', 'destination_node_ip_address'],
                                               registry=registry),
                "mdev": prometheus_client.Gauge('kube_node_ping_rtt_mdev',
                                                'mean deviation of round-trip times',
                                                ['destination_node', 'destination_node_ip_address'],
                                                registry=registry)}


def validate_envs():
    envs = {"MY_NODE_NAME": os.getenv("MY_NODE_NAME"), "PROMETHEUS_TEXTFILE_DIR": os.getenv("PROMETHEUS_TEXTFILE_DIR"),
            "PROMETHEUS_TEXTFILE_PREFIX": os.getenv("PROMETHEUS_TEXTFILE_PREFIX")}

    for k, v in envs.items():
        if not v:
            raise ValueError("{} environment variable is empty".format(k))

    return envs


@prometheus_exceptions_counter.count_exceptions()
def compute_results(results):
    computed = {}

    matches = FPING_REGEX.finditer(results)
    for match in matches:
        ip = match.group(1)
        ping_results = match.group(2)
        if "duplicate" in ping_results:
            continue
        splitted = ping_results.split(" ")
        if len(splitted) != 30:
            raise ValueError("ping returned wrong number of results: \"{}\"".format(splitted))

        positive_results = [float(x) for x in splitted if x != "-"]
        if len(positive_results) > 0:
            computed[ip] = {"sent": 30, "received": len(positive_results),
                            "rtt": sum(positive_results),
                            "max": max(positive_results), "min": min(positive_results),
                            "mdev": statistics.pstdev(positive_results)}
        else:
            computed[ip] = {"sent": 30, "received": len(positive_results), "rtt": 0,
                            "max": 0, "min": 0, "mdev": 0}
    if not len(computed):
        raise ValueError("regex match\"{}\" found nothing in fping output \"{}\"".format(FPING_REGEX, results))
    return computed


@prometheus_exceptions_counter.count_exceptions()
def call_fping(ips):
    cmdline = FPING_CMDLINE + ips
    process = subprocess.run(cmdline, stdout=subprocess.PIPE,
                             stderr=subprocess.STDOUT, universal_newlines=True)
    if process.returncode == 3:
        raise ValueError("invalid arguments: {}".format(cmdline))
    if process.returncode == 4:
        raise OSError("fping reported syscall error: {}".format(process.stderr))

    return process.stdout


envs = validate_envs()

files = glob.glob(envs["PROMETHEUS_TEXTFILE_DIR"] + "*")
for f in files:
    os.remove(f)

labeled_prom_metrics = []

while True:
    with open("/config/nodes.json", "r") as f:
        config = json.loads(f.read())

    if labeled_prom_metrics:
        for node in config:
            if (node["name"], node["ipAddress"]) not in [(metric["node_name"], metric["ip"]) for metric in labeled_prom_metrics]:
                for k, v in prom_metrics.items():
                    v.remove(node["name"], node["ipAddress"])

    labeled_prom_metrics = []

    for node in config:
        metrics = {"node_name": node["name"], "ip": node["ipAddress"], "prom_metrics": {}}

        for k, v in prom_metrics.items():
            metrics["prom_metrics"][k] = v.labels(node["name"], node["ipAddress"])

        labeled_prom_metrics.append(metrics)

    out = call_fping([prom_metric["ip"] for prom_metric in labeled_prom_metrics])
    computed = compute_results(out)

    for dimension in labeled_prom_metrics:
        result = computed[dimension["ip"]]
        dimension["prom_metrics"]["sent"].inc(computed[dimension["ip"]]["sent"])
        dimension["prom_metrics"]["received"].inc(computed[dimension["ip"]]["received"])
        dimension["prom_metrics"]["rtt"].inc(computed[dimension["ip"]]["rtt"])
        dimension["prom_metrics"]["min"].set(computed[dimension["ip"]]["min"])
        dimension["prom_metrics"]["max"].set(computed[dimension["ip"]]["max"])
        dimension["prom_metrics"]["mdev"].set(computed[dimension["ip"]]["mdev"])

    prometheus_client.write_to_textfile(
        envs["PROMETHEUS_TEXTFILE_DIR"] + envs["PROMETHEUS_TEXTFILE_PREFIX"] + envs["MY_NODE_NAME"] + ".prom", registry)
This script runs on each K8s node and sends ICMP packets to all instances of the Kubernetes cluster twice per second. The collected results are stored in the text files.
The script is included in the Docker image:
FROM python:3.6-alpine3.8
COPY rootfs /
WORKDIR /app
RUN pip3 install --upgrade pip && pip3 install -r requirements.txt && apk add --no-cache fping
ENTRYPOINT ["python3", "/app/node-ping.py"]
Also, we have created a ServiceAccount and a corresponding role with the only permission provided — to get the list of nodes (so we can know their addresses):
---
apiVersion: v1
kind: ServiceAccount
metadata:
  name: node-ping
  namespace: kube-prometheus
---
kind: ClusterRole
apiVersion: rbac.authorization.k8s.io/v1
metadata:
  name: kube-prometheus:node-ping
rules:
- apiGroups: [""]
  resources: ["nodes"]
  verbs: ["list"]
---
kind: ClusterRoleBinding
apiVersion: rbac.authorization.k8s.io/v1
metadata:
  name: kube-prometheus:kube-node-ping
subjects:
- kind: ServiceAccount
  name: node-ping
  namespace: kube-prometheus
roleRef:
  apiGroup: rbac.authorization.k8s.io
  kind: ClusterRole
  name: kube-prometheus:node-ping
Finally, we need a DaemonSet which runs in all instances of the cluster:
---
apiVersion: extensions/v1beta1
kind: DaemonSet
metadata:
  name: node-ping
  namespace: kube-prometheus
  labels:
    tier: monitoring
    app: node-ping
    version: v1
spec:
  updateStrategy:
    type: RollingUpdate
  template:
    metadata:
      labels:
        name: node-ping
    spec:
      terminationGracePeriodSeconds: 0
      tolerations:
      - operator: "Exists"
      serviceAccountName: node-ping
      priorityClassName: cluster-low
      containers:
      - resources:
          requests:
            cpu: 0.10
        image: private-registry.test.com/node-ping/node-ping-exporter:v1
        imagePullPolicy: Always
        name: node-ping
        env:
          - name: MY_NODE_NAME
            valueFrom:
              fieldRef:
                fieldPath: spec.nodeName
          - name: PROMETHEUS_TEXTFILE_DIR
            value: /node-exporter-textfile/
          - name: PROMETHEUS_TEXTFILE_PREFIX
            value: node-ping_
        volumeMounts:
          - name: textfile
            mountPath: /node-exporter-textfile
          - name: config
            mountPath: /config
      volumes:
        - name: textfile
          hostPath:
            path: /var/run/node-exporter-textfile
        - name: config
          configMap:
            name: node-ping-config
      imagePullSecrets:
      - name: my-private-registry
The last operating details of this solution:
- When Python script is executed, its results (that is, text files stored on the host machine in the
/var/run/node-exporter-textfiledirectory) are passed to the DaemonSet node-exporter. - This node-exporter is launched with the
--collector.textfile.directory /host/textfileargument where/host/textfileis a hostPath to/var/run/node-exporter-textfile. (You can read more about the textfile collector in the node-exporter here.) - In the end, node-exporter reads these files, and Prometheus collects all data from the node-exporter.
What are the results?
Now it is time to enjoy the long-awaited results. After the metrics have been created, we can use and, of course, visualize them. Here is how they look.
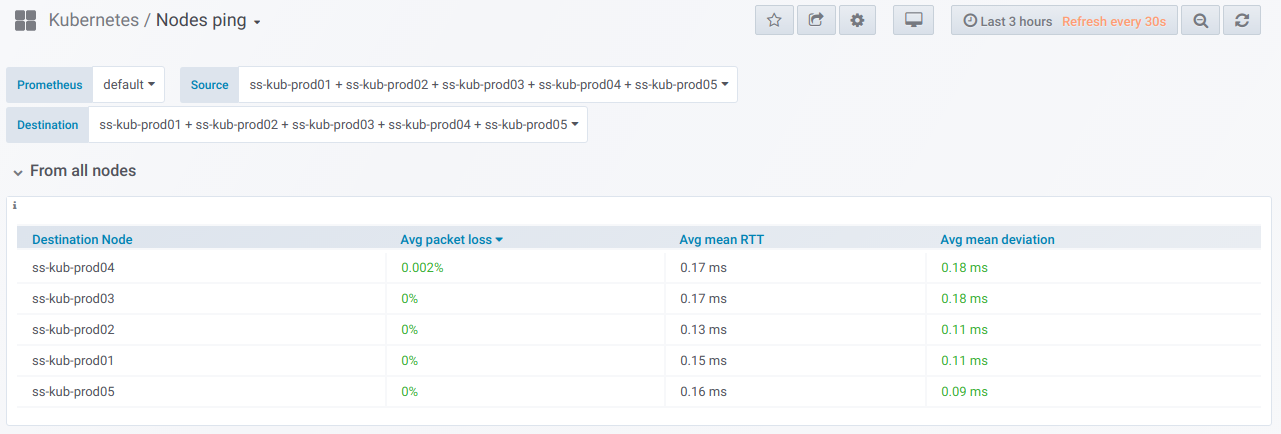
Firstly, there is a general selector where you can choose the nodes to check their “to” and “from” connectivity. You’re getting a summary table for pinging results of selected nodes for the period specified in the Grafana dashboard:
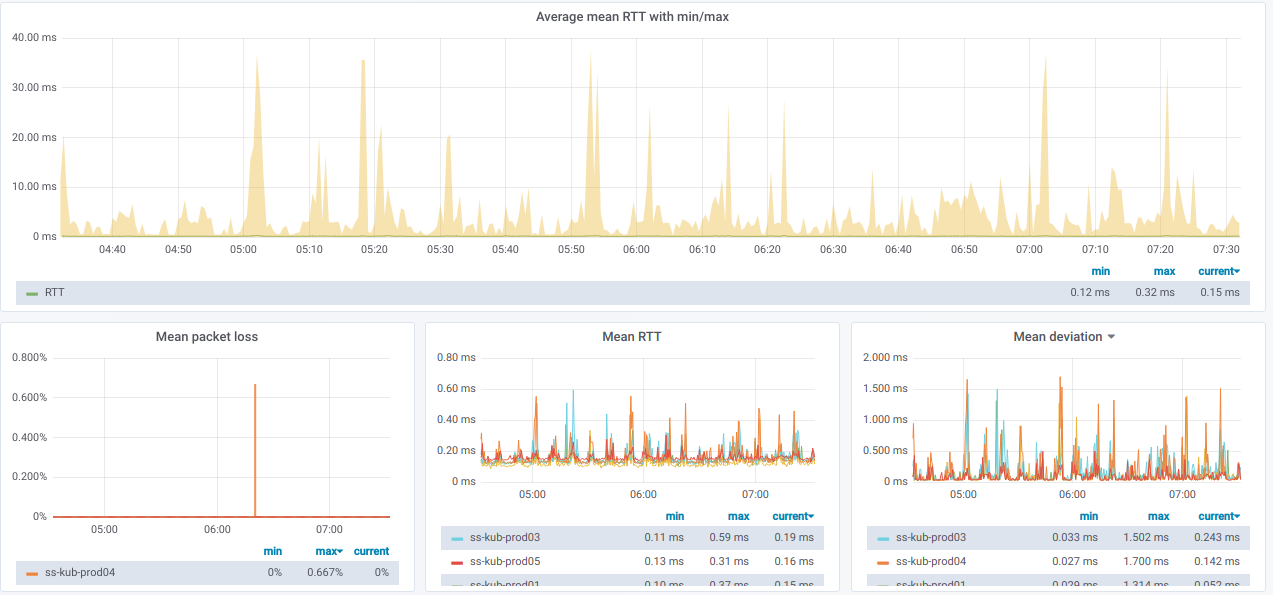
And here are graphs with the combined statistics about selected nodes:
Also, we have a list of records where each record links to graphs for each specific node selected in the Source node:

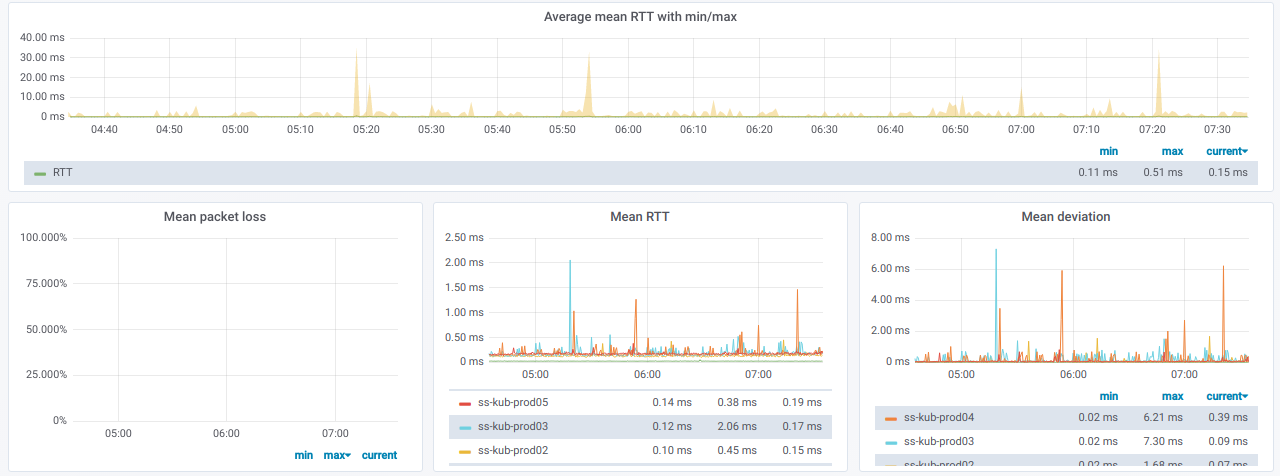
If you expand such a record, you will see detailed ping statistics from a current node to all other nodes which have been selected in the Destination nodes:

And here are the relevant graphs:
How would the graphs with bad pings between nodes look like?
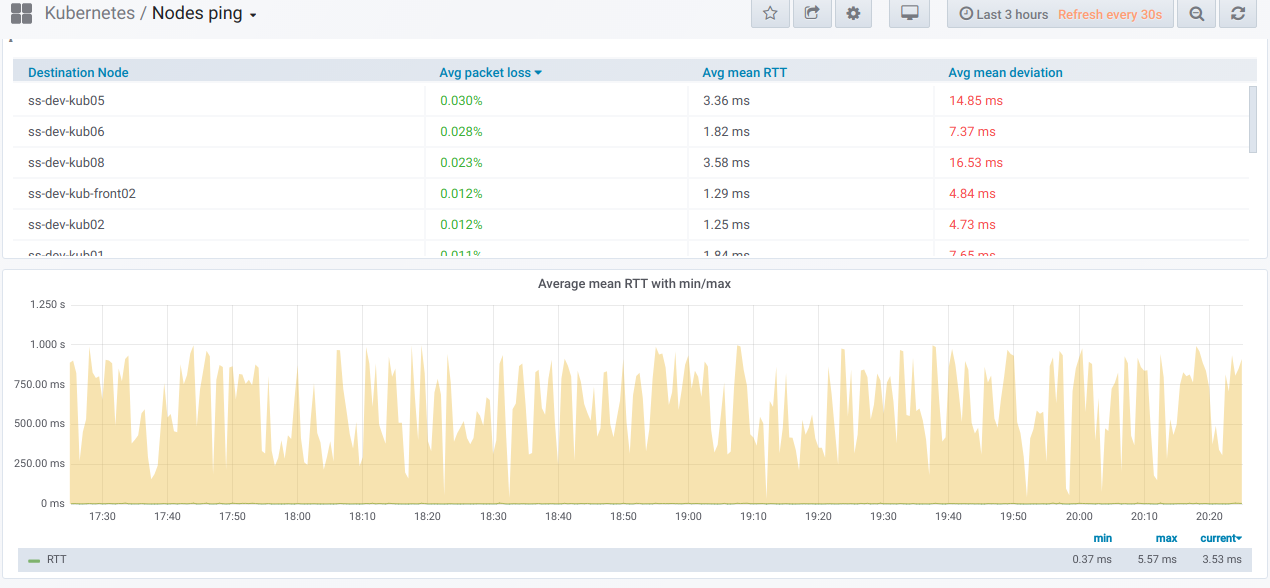
If you’re observing something like that in real life — it’s time for troubleshooting!
Finally, here is our visualization for pinging external hosts:
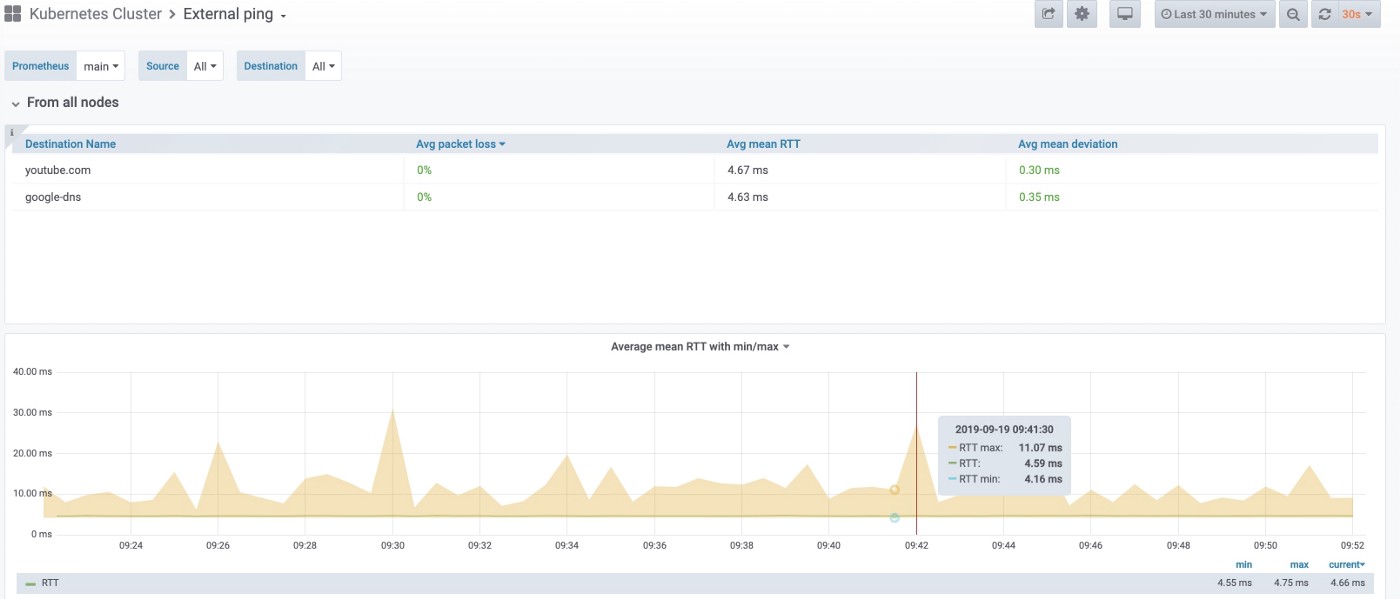
We can check either this overall view for all nodes, or a graph for any particular node only:
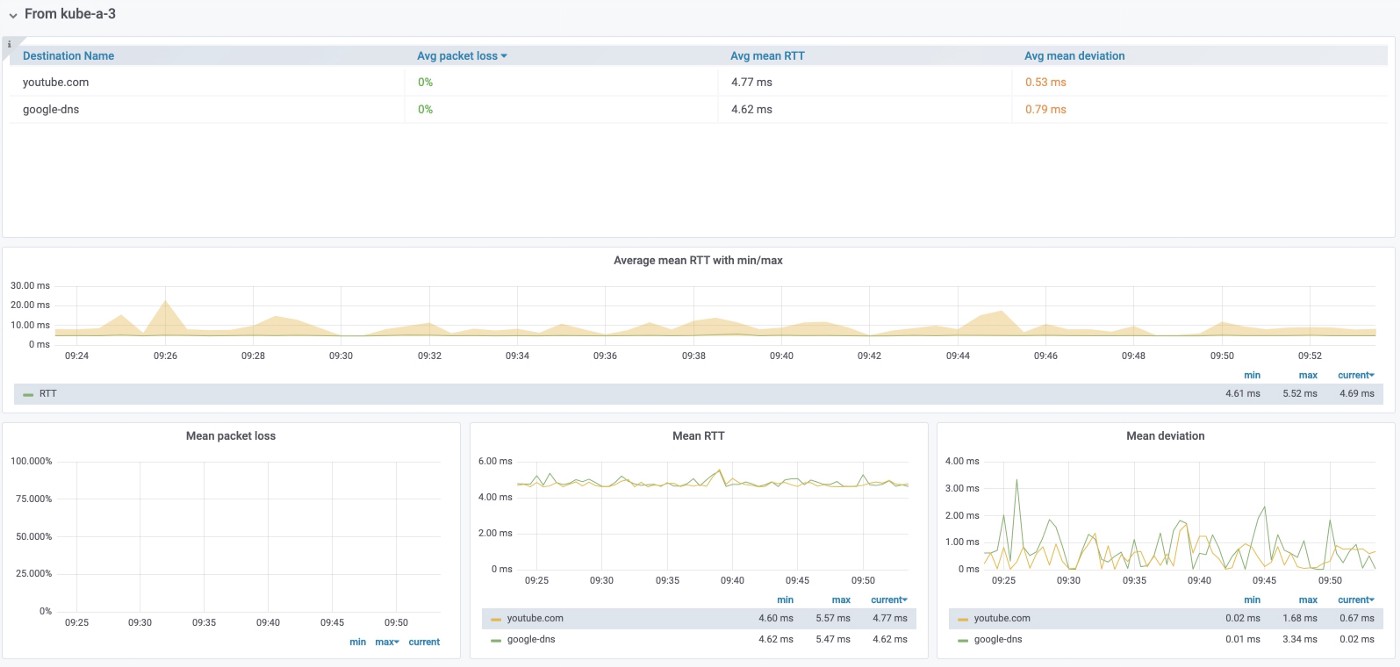
It might be useful when you observe connectivity issues affecting some specific nodes only.


Where can I find the json of the created dashboards?
Hi Matheus! It’s a really old one, but here is the gist. It also required interval_rv to work properly (at that moment, we produced a relevant patch for Grafana here).