One day, we ran into a problem of segmentation of our data (logs) stored in Elasticsearch. It has made us change our approach to backups and managing indices.
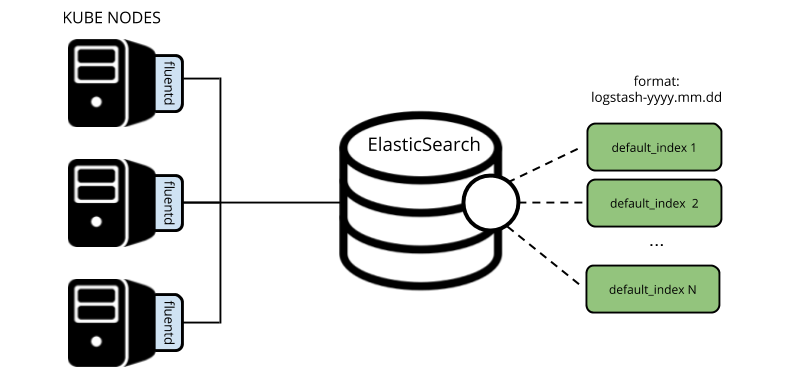
It all started shortly after we successfully set up and run the production environment. It was a working Kubernetes cluster with fluentd as a data collection tool which accumulated all cluster logs and sent them directly to logstash-yyyy.mm.dd indices…

Well, as time went by, the developers decided they needed to keep some logs for a longer time (90 days). Back then, that wasn’t feasible: keeping current indices for 90 days required a tremendous amount of space that exceeded all reasonable limits. That is why we decided to implement a specific index-pattern for such applications and configure separate retention for it.
Segmentation of logs
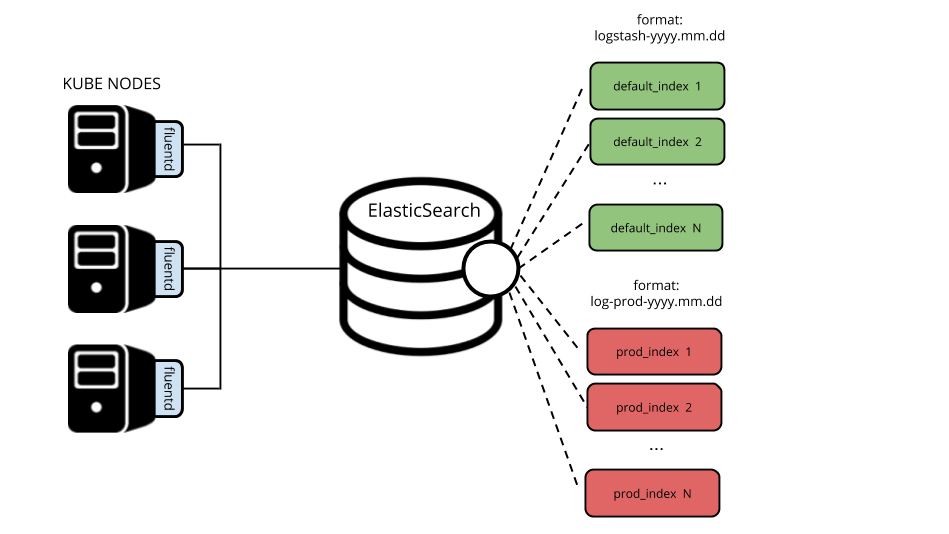
To fulfill our idea and separate “necessary” logs from “unnecessary,” we took advantage of fluentd’s match parameter and created a special section in the output.conf. It is used for matching in corresponding services in the production namespace according to tags defined for the input plugin. @id and logstash_prefix values have been also modified have been also modified to separate the output.
Here are the snippets of the resulting output.conf:
<match kubernetes.var.log.containers.**_production_**>
      @id elasticsearch1
      @type elasticsearch
      logstash_format true
      logstash_prefix log-prod
     ...
</match>
<match kubernetes.**>
      @id elasticsearch
      @type elasticsearch
      logstash_format true
      logstash_prefix logstash
     ...
</match>
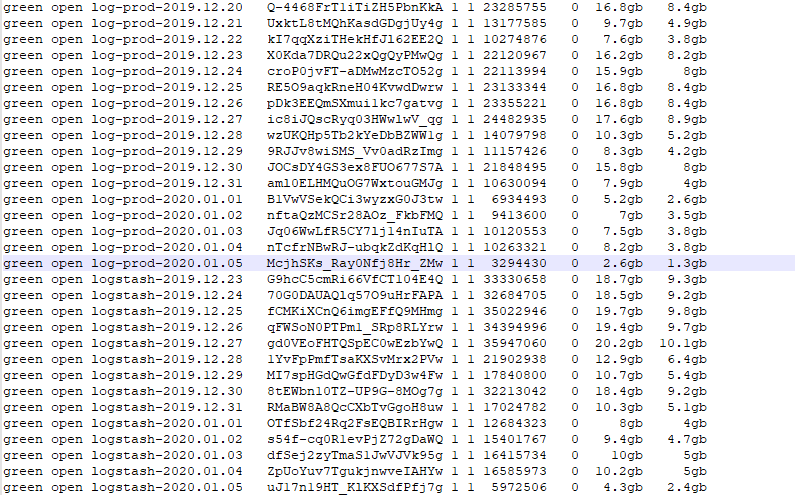
Now we have two types of indices: log-prod-yyyy.mm.dd and logstash-yyyy.mm.dd.

Deleting indices
At that moment, we already had the curator in the cluster, which was deleting indices older than 14 days. It was defined as a CronJob object, allowing us to deploy it right into the Kubernetes cluster.
Below is the related section in the action_file.yml file:
-
    actions:
      1:
        action: delete_indices
        description: >-
          Delete indices older than 14 days (based on index name), for logstash-
          prefixed indices. Ignore the error if the filter does not result in an           actionable list of indices (ignore_empty_list) and exit cleanly.
        options:
          ignore_empty_list: True
          timeout_override:
          continue_if_exception: False
          disable_action: False
          allow_ilm_indices: True
        filters:
        - filtertype: pattern
          kind: prefix
          value: logstash
        - filtertype: age
          source: name
          direction: older
          timestring: '%Y.%m.%d'
          unit: days
          unit_count: 14
However, we have decided that using curator is excessive since it runs as separate software, requires individual configuration, and is launched by Cron. After all, you can always do the cleaning using the index lifecycle policy.
In Elasticsearch, starting with version 6.6 (released in January 2019), it has become possible to attach to an index template a policy that would track index lifetime. You can use policies not only for managing cleanup but also for other tasks, simplifying processing of indices (e.g., sorting by size and not by date).
For this, we have created two policies:
PUT _ilm/policy/prod_retention
{
    "policy" : {
      "phases" : {
        "delete" : {
          "min_age" : "90d",
          "actions" : {
            "delete" : { }
          }
        }
      }
    }
  }

PUT _ilm/policy/default_retention
{
    "policy" : {
      "phases" : {
        "delete" : {
          "min_age" : "14d",
          "actions" : {
            "delete" : { }
          }
        }
      }
    }
  }
… and attached them to the appropriate index templates:
PUT _template/log_prod_template
{
  "index_patterns": ["log-prod-*"],
  "settings": {
    "index.lifecycle.name": "prod_retention",
  }
}
PUT _template/default_template
{
  "index_patterns": ["logstash-*"],
  "settings": {
    "index.lifecycle.name": "default_retention",
  }
}
From now on, the Elasticsearch cluster will be managing the data storage by itself. It means that all indices fitting the index_patterns defined above will be removed after the number of days specified by the policy.
Unfortunately, another problem arises.
Reindexing within a cluster and remote clusters
The policies and templates we’ve created, as well as changes in the fluentd configuration, will influence newly created indices only. To process the data that we already have, we need to reindex it using the Reindex API.
Thus, to apply new policies, we have to sift through the frozen indices*, isolate the necessary logs, and then reindex them.
* Please also note that frozen indices are not eligible for reindexing without preliminary unfreezing them (POST //_unfreeze).
You can do this with these two queries:
POST _reindex
{
  "source": {
    "index": "logstash-2019.10.24",
    "query": {
      "match": {
        "kubernetes.namespace_name": "production"
      }
    }
  },
  "dest": {
    "index": "log-prod-2019.10.24"
  }
}

POST _reindex
{
  "source": {
    "index": "logstash-2019.10.24"
    "query": {
      "bool": {
        "must_not": {
          "match": {
            "kubernetes.namespace_name": "production"
           }
        }
      }
    }
  },
  "dest": {
    "index": "logstash-2019.10.24-ri"
  }
}
Now you can delete old indices.
But that is not all — there are other challenges. As you remember, a curator in the cluster deletes indices once the 14 day retention period is reached. Thus, for the relevant services, we had to find a way to process the data that has been deleted already. Well, backups came in handy in this case.
In the basic case (like ours), backups are created by running elasticdump for all indices at once:
/usr/bin/elasticdump --all $OPTIONS --input=http://localhost:9200 --output=$Well, we could not process all the data available (beginning at the moment the production was started) since there wasn’t that much space in the cluster. Besides, access to logs from the backup was needed as soon as possible.
We decided to deploy a temporary cluster to solve this problem. It was used to restore the backed up data and to process logs (in a manner described above). Simultaneously, we started exploring ways to make backing up data more convenient (see below for more details).
Here is a guide to setting up and configuring the temporary cluster:
- Install Elasticsearch on a separate server with a sufficiently large hard drive.
2. Deploy the backup from the existing dump file:
/usr/bin/elasticdump --bulk --input=dump.json --output=http://127.0.0.1:9200/3. Please note that the cluster status will not turn green since we transfer the dump to a single-node setup. However, there is no reason to worry about that because our only objective is to get primary shards.
4. It is worth recalling that you have to whitelist the remote cluster in the elasticsearch.yaml of your original cluster (and reload its configuration) to reindex the data:
reindex.remote.whitelist: 1.2.3.4:92005. Now, let’s reindex the remote cluster’s data using the existing production cluster:
POST _reindex
{
  "source": {
    "remote": {
      "host": "http://1.2.3.4:9200"
    },
    "size": 10000,
    "index": "logstash-2019.10.24",
    "query": {
      "match": {
        "kubernetes.namespace_name": "production"
      }
    }
  },
  "dest": {
    "index": "log-prod-2019.10.24"
  }
}
The above request allows us to siphon documents off the indices in the remote cluster that will be transmitted to the production cluster over the network. Then, inside the temporary cluster, we will filter out all documents that do not match our request.
You can use size and slice parameters to speed up the reindexing:
sizeallows you to change the batch size (number of documents for indexing transferred as a single batch);sliceallows you to split a reindex request to six subtasks to parallelize the reindexing process (the parameter does not support remote clusters).
At the destination Elasticsearch cluster, we set up index templates for maximum performance.
When all the logs ended up in one place being split as required, we deleted the temporary cluster:

Elasticsearch backups
It is time to get back to backups. You know, running elasticdump for all indices is far from optimal. There is at least one apparent reason for this: restoring can prove to be excessively time-consuming but there might be cases when every moment counts.
Fortunately, you can leave this task to Elasticsearch itself, or more precisely, to the built-in Snapshot Repository based on S3. Here are the key reasons why we have chosen this approach:
- The ease of backing up and restoring data since we use the native syntax of Elasticsearch queries.
- Snapshots are incremental: each snapshot only adds data that is not part of an earlier snapshot.
- You can restore any index from a snapshot (or even restore cluster’s global state).
- Amazon S3 seems to be a more reliable choice for storing backups than a simple file (given the fact that we typically use S3 in the HA mode).
- Portability: we are not tied to specific providers and can deploy S3 in the new location by ourselves.
You have to install an additional Elasticsearch plugin to back up data to the S3 storage. Using it, Snapshot Repository will communicate with the S3. The configuration comes down to the following:
- Install Elasticsearch’s S3 plugin to all nodes:
bin/elasticsearch-plugin install repository-s3… and whitelist the S3 repository in the elasticsearch.yml:
    Repositories.url.allowed_urls:
- "https://example.com/*"
2. Add SECRET and ACCESS keys to the Elasticsearch keystore. By default, the default user is used to connect to the S3:
bin/elasticsearch-keystore add s3.client.default.access_key
bin/elasticsearch-keystore add s3.client.default.secret_key
… and then restart the Elasticsearch service on all nodes one by one.
3. Create the snapshots repository:
PUT /_snapshot/es_s3_repository
{
  "type": "s3",
  "settings": {
    "bucket": "es-snapshot",
    "region": "us-east-1",
    "endpoint": "https://example.com"
  }
}
In our case, you can use an example from the documentation where the name of the snapshot has the following format: snapshot-2018.05.11.
PUT /_snapshot/my_backup/%3Csnapshot-%7Bnow%2Fd%7D%3E4. Now it is time to test restoring an index:
POST /_snapshot/es_s3_repository/snapshot-2019.12.30/_restore
{
  "indices": "logstash-2019.12.29",
  "rename_pattern": "logstash-(.+)",
  "rename_replacement": "restored_index_$1"
}
This way, we restore the index next to the original one by simply renaming it. However, it is possible to restore it into the primary index as well. For this, the index in the cluster must be closed and have the same number of shards as the index in the snapshot.
You can get the status of the running snapshot via API by specifying its name and checking the state field:
GET /_snapshot/es_s3_repository/snapshot_2019.12.30You can use standard monitoring services to follow the state of recovery. Initially, the cluster goes into the red state since the primary shards of your indices are getting restored. Once the recovery is complete, the cluster (and indices) switches to the yellow state until the required number of replicas is created.
You can also monitor the state by specifying the wait_for_completion=true parameter right in the request.
In the end, we will get an exact copy of the index from the snapshot:
green open restored_index_2019.12.29    eJ4wXqg9RAebo1Su7PftIg 1 1 1836257 0   1.9gb 1000.1mb
green open logstash-2019.12.29          vE8Fyb40QiedcW0k7vNQZQ 1 1 1836257 0   1.9gb 1000.1mb
Conclusion and limitations
We believe the following solutions are optimal in our case with the Elasticsearch cluster:
- Configuring the output plugin in the fluentd. It allows separation of logs right on the way out of the cluster.
- Defining the index lifecycle policy. With it, the Elasticsearch cluster can manage the data storage all by itself.
- Implementing a new way of backing up data via the snapshot repository (instead of backing up an entire cluster). Snapshots make it possible to restore individual indexes from the S3 storage, which proved to be much more convenient.
While we have shifted backing up data to the Elasticsearch cluster itself, taking snapshots and monitoring are still our tasks. Thus, we will make API requests, track statuses (via the wait_for_completion parameter), and so on, using scripts. Despite its promise, the backup repository still has one major disadvantage: lack of plugins. For example, it does not support WebDAV (e.g., if, instead of S3, you would need something more simplistic but just as portable).
Overall, such isolation of the system correlates poorly with a centralized approach to making backups. Unfortunately, we still haven’t found a universal, all-purpose, Open-Source tool that would fit this niche.


Comments