

Today, we are happy to continue our series of articles (part 1, part 2) dedicated to the challenges we face during our everyday operations. That’s our way to share our thoughts at the time and describe the actions that allowed us to overcome those obstacles successfully.
Here, we will tell you the story of one Linux server migration that took much longer than expected. Also, you will have a chance to know the ClickHouse Kubernetes operator, learn how to accelerate the data recovery in a broken PostgreSQL replica, and discover the consequences a CockroachDB upgrade can lead to. You will definitely find here some useful pieces of information (not to mention the fascinating stories themselves), so, please, read on!
Case #1. Migration to the VM took longer than expected
Migration plan
What could go wrong if you need to migrate a legacy application from a bare-metal server to a virtual machine? It is worth noting that the application (and its infrastructure) is based on a well-known and well-understood stack consisting of Linux, PHP, Apache, Gearman, MySQL. The reason for migration is also mundane: the client wants to reduce hosting costs by turning down the physical server that is solely used for an auxiliary service (the parser for social networking service).
As a matter of fact, there can be other reasons for migration as well (e.g., you want it to simplify the maintenance and scaling). However, I won’t delve into this.
When writing this article, I unexpectedly discovered that there aren’t many publications describing the migration of servers to virtual machines without using some kind of virtualization technology. In most articles, migration is performed using some external tools. We, however, show you our regular way to perform it.
The general plan is as follows:
- Clean up the server and figure out the amount of resources required.
- Get the virtual server ready, allocate memory, CPU cores, reserve IP addresses.
- If you want to minimize downtime, set up an external load balancer (you can switch it to a newly created virtual server when it is ready) or run a copy of the application.
- Bootstrap the system using the OS/distribution image of your choice. It must contain all the necessary drivers to copy the data to the virtual machine somehow.
- Create a chroot environment to modify the system bootloader.
- Switch user requests (web traffic, etc) or service tasks to the new OS.
Well, let’s apply this plan to our case and find out what abnormal situations it could create.
Preparing for migration
Before starting the migration, we decided to clean up the server. It contained around 300 GB of data. However, there were many outdated backups, old logs, and some database excesses (see below). In the end, we were fortunate enough to reduce the occupied space to 60 GB.
As a side note, we would like to say a few words about slimming down the MySQL database. We had version 5.5 of the original MySQL DBMS, and it was not configured for innodb_file_per_table. Because of this, as you may guess, the ibdata1 file has grown to 40 GB. In such cases, we normally use pt-online-schema-change (part of Percona Toolkit).
You simply need to verify the tables stored in shared innodb tablespace:
SELECT i.name FROM information_schema.INNODB_SYS_TABLES i WHERE i.space = 0;… and then run the pt-online-schema-change. This command allows you to perform various actions on tables without downtime. With it, we will OPTIMIZE all the found tables:
pt-online-schema-change --alter "ENGINE=InnoDB" D=mydb,t=test --executeOn the other hand, you can leave the ibdata1 file as is if it is not too large. To get rid of all the garbage in the ibdata1, you have to perform mysqldump for all databases except for the mysql and performance_schema databases. Now you can stop MySQL and delete the ibdata1 file.
After the restart, MySQL will create the missing files in the InnoDB system namespace. Load the data to MySQL, and we’re done!
Preparing disks and copying data
One would think that the next step involves copying data using the dd tool. However, that was not feasible in our case. The server had RAID 1 configuration created with md, and we didn’t want to migrate it to the VM since its partitions are created as a RAID 10-based Volume Group. Plus, the partitions were quite large (even if less than 15% of space was occupied). Therefore, we decided to migrate the VM using rsync. Such a venture does not scare us: we’ve successfully performed many migrations using this approach (while it is somewhat more complicated than copying all partitions using dd).
What do you need to do? Some steps of the process are similar to the one involving the dd tool:
- Create a VM of the required size and boot from systemrescuecd.
- Create partitions on the disk similar to the server. Typically, you will need root and boot volumes (you can use the
partedutility to make them). Suppose, our disk is located at/dev/vda:parted /dev/vda mklabel gpt mkpart P1 ext3 1MiB 4MiB t 1 bios_grub mkpart P2 ext3 4MiB 1024MiB mkpart P3 ext3 1024MiB 100% t 3 lvm - Create filesystems on the partitions. We usually use ext3 for boot and ext4 for root.
- Mount volumes to the
/mntdirectory that we are going to chroot to:mount /dev/vda2 /mnt mkdir -p /mnt/boot mount /dev/vda1 /mnt/boot - Enable networking. Current versions of systemrescuecd are built on ArchLinux, so the system is configured via
nmcli:nmcli con add con-name lan1 ifname em1 type ethernet ip4 192.168.100.100/24 gw4 192.168.100.1 ipv4.dns "8.8.8.8 8.8.4.4" nmcli con up lan1 - Copy the data:
rsync -avz --delete --progress --exclude "dev/*" --exclude "proc/*" --exclude "sys/*" rsync://old_ip/root/ /mnt/ - Mount dev, proc, sys:
mount -t proc proc /mnt/proc mount -t sysfs sys /mnt/sys mount --bind /dev /mnt/dev - Switch to the resulting chroot directory:
chroot /mnt bash - Edit
fstabby changing the addresses of the mount points to the real ones. - Now you need to enable the bootloader:
- Restore the boot sector:
grub-install /dev/vda - Update the grub config:
update-grub
- Restore the boot sector:
- Update the initramfs:
update-initramfs-k all-u - Restart the virtual machine and load the migrated system.
We migrated hundreds of virtual machines and servers using this algorithm, but this time was different…
Problem and solution
The system kept coming back to partitions that existed on the server before the migration. And the problem did not relate to mdadm in any way — you can delete /etc/mdadm/mdadm.conf and run update-initramfs:
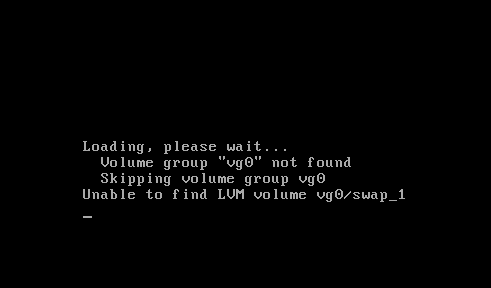
However, the system kept on trying to mount /dev/mapped/vg0-swap. It turns out the initrd is trying to mount the swap partition because of the configuration file generated by the Debian installer. To be more precise, its component called base-installer creates /etc/initramfs-tools/conf.d/resume during the installation process and lives in your system without any references in currently installed packages. Okay, let’s delete the irrelevant file, build the initramfs, and restart! But busybox console is still here…
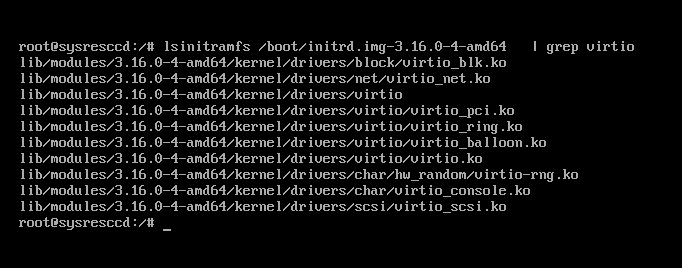
Let’s check if the system detects our volumes. lsblk does not list anything; the search for device files in /dev/disk/by-uuid/ returns nothing. Oh, it turned out, the Debian Jessie 3.16 kernel was compiled without builtin support for virtio devices. Fortunately, modules can be easily added: you need to specify them in /etc/initramfs-tools/modules or change the policy for adding modules in /etc/initramfs-tools/initramfs.conf to MODULES=most.
However, this time, the magic did not happen again. Modules were there, but the system could not detect the disks anyway:
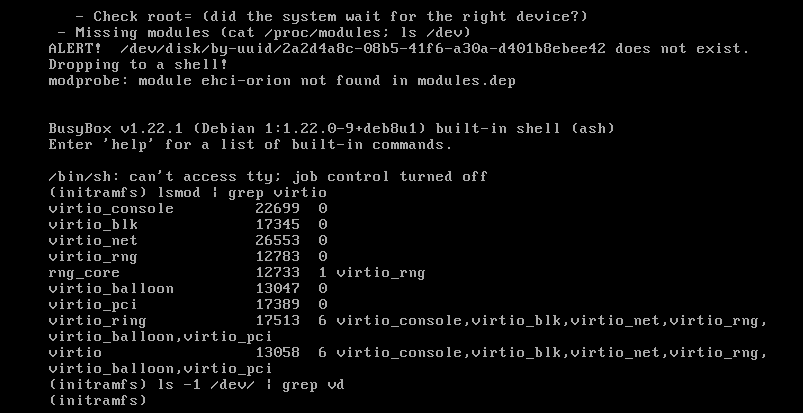
We had to switch the disk from Virtio to SCSI in the VM settings. This way, we were finally able to load the virtual machine.
There was no network in the booted system. Our attempts to use network drivers (the virtio_net module) have failed:
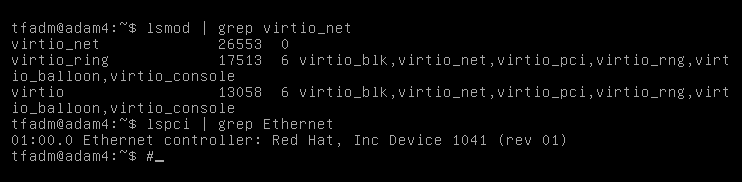
We decided to switch the network adapters to emulate the Intel e1000e network card to avoid complicating the task and delaying the switching. We stopped the VM and changed the driver. However, when it was started, we got the following error: “failed to find romfile “efi-e1000.rom”.
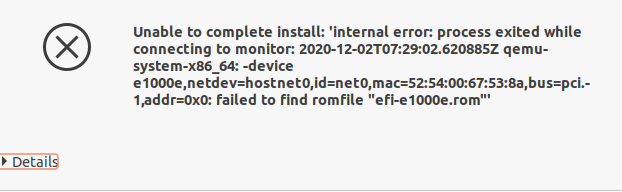
We googled for a solution and got a striking result: it turns out the ROM file was missed a while ago, and maintainers were not going to return it to the package. Fortunately, the file existed in the ipxe-qemu package, so we took advantage of this. All you need to do is to unpack the package (ipxe-qemu) and copy /usr/lib/ipxe/qemu/efi-e1000.rom to /usr/share/qemu/efi-e1000e.rom. After that, the virtual machine with the emulated adapter starts to load.
But do not think that our adventure is over. It is way too soon to think we’re done here when it comes to e1000e… This driver is famous for its inclination to restart the network adapter under the high load. It is precisely what happened when we proceeded to upload the application database. We had to resort to the old method with disabling the “hardware” offload:
ethtool -K eth0 gso off gro off tso offFinally, we were able to settle the system and start the application. Probably, there are other approaches to solving the above problem. However, the quest for a better solution would have taken way more time. That suited neither us nor our customer since a specific deadline for migration was set.
Case #2. Security-related trick for the ClickHouse K8s operator
Recently, we have embarked on the ClickHouse operator by Altinity. It allows you to flexibly deploy ClickHouse clusters on Kubernetes:
- with replication — for increased reliability;
- with shards — for better horizontal scaling.
However, we have encountered an unexpected problem. It turns out you cannot set a password for the default user, which is used for remote_servers by default. The problem is that there is no place for remote_servers password in the templates for generating cluster configs. Because of that, you cannot work with the distributed table engine concurrently — it fails with the following message:
[2020-11-25 15:00:20] Code: 516, e.displayText() = DB::Exception: Received from chi-cluster-cluster-0-0:9000. DB::Exception: default: Authentication failed: password is incorrect or there is no user with such name.
Fortunately, ClickHouse allows whitelisting using rDNS, IP, host regexp. So you can add the following to the cluster configuration:
     users:
        default/networks/host_regexp: (chi-cluster-[^.]+\d+-\d+|clickhouse\-cluster)\.clickhouse\.svc\.cluster\.local$
As a result, the cluster can operate normally. There is a related issue in the operator’s repository (we also added our workaround to it). However, it doesn’t look like there is going to be any progress soon. Perhaps, it is because passwords must be stored in the remote_servers configuration.
Case #3. How to speed up syncing of PostgreSQL replicas
Unfortunately, nothing lasts forever and any machine gets old with time. And that leads to various failures. One of such failures happened with our PostgreSQL database replica: one of the disks failed, and the disk array switched to read-only mode.
After replacing the disk and restarting the server, we began to wonder how to sync it most effectively, given that the project has a fairly large database (over 2 TB).
Our task was complicated by the fact that replication slots were not enabled in the cluster. While we tried to get the failed replica back to life, all the required WAL segments were discarded. Archiving of WAL files was also disabled in the cluster. By the way, the replication slots themselves can be dangerous in PostgreSQL versions before v13 because they can cause unbounded growth of disk usage (while a novice engineer can easily overlook that risk). Fortunately, starting with version 13, you can limit the slot size by setting the max_slot_wal_keep_size parameter.
The next logical step is to copy the entire database using pg_basebackup. However, according to our calculations, such an operation would take at least nine days, and all this time our backup PgSQL server would be unavailable. So what do we do? First of all, we have almost up-to-date files. Some of them — such as old partitions of the partitioned tables — are unchanged. Unfortunately, pg_basebackup backs up the entire database cluster only. If only we could invent a method to resume syncing the database from the moment of a failure…
And then I remembered the method we used to make backups back in the days of PostgreSQL 9.1. You can learn more about it in Continuous Archiving and Point-in-Time Recovery (PITR) docs. It is extremely simple and is based on the fact that you can invoke the pg_start_backup command to copy PgSQL files (and then stop the procedure with pg_stop_backup). So, we came up with the following plan:
- Create a replication slot for the replica by running the following command on the master:
SELECT pg_create_physical_replication_slot('replica', true);Note it is critical to set the second argument to true. In this case, the database would immediately start saving WALs to this slot without waiting for the first connection to it.
- Run the pg_start_backup command on master:
SELECT pg_start_backup('copy', true);Once again, the second argument must be set to true. In this case, the database would immediately perform a checkpoint, and copying can be started.
- Copy the database to the replica. We used
rsyncfor this:rsynс -avz --delete --progress rsync://leader_ip/root/var/lib/postgresql/10/main/ /var/lib/postgresql/10/main/With these parameters, rsync would replace the files that were changed.
- After copying is complete, run the following command on the master:
SELECT pg_stop_backup(); - Create the following
recovery.conffile on the replica that specifies our replica slot:standby_mode = 'on' primary_conninfo = 'user=rep host=master_ip port=5432 sslmode=prefer sslcompression=1 krbsrvname=postgres target_session_attrs=any' recovery_target_timeline = 'latest' primary_slot_name = replica - Start the replica.
- Delete the replication slot on the replica since it will be copied from the master:
SELECT pg_drop_replication_slot('replica'); - Check if it is available in the pg_stat_replication system table.
However, I missed one point. We have copied all the WAL files that were on the master (including those that were not required). That is why the disk space on the replica server started to run out on the very following day. And we had to find a way to discard all the unneeded WAL segments.
As you know, the checkpoint_timeout is 1 hour. Therefore, we have to delete all files older than 1 hour, but starting with what moment? To find it out, let’s run the following query on master:
SELECT pg_walfile_name(replay_lsn) from pg_stat_replication;
     pg_walfile_name
--------------------------
 0000000200022107000000C8
(1 row)
Check the time of last status change for this file:
stat /var/lib/postgresql/10/main/pg_wal/0000000200022107000000C8
...
Access: 2020-12-02 13:11:20.409309421 +0300
Modify: 2020-12-02 13:11:20.409309421 +0300
Change: 2020-12-02 13:11:20.409309421 +0300
… and delete all older files. You can use find and bash to do this:
# calculate the starting point in time
deleteBefore=`expr $(date --date='2020-12-02 13:11:20' +%s) - 3600`
mins2keep=`expr $(expr $(expr $(date +%s) - $deleteBefore) / 60) + 1`
# delete all files larger than 16 MB (the standard size of WAL segments),
# that are older than mins2keep
find /var/lib/postgresql/10/main/pg_wal/ -size 16M -type f -mmin +$mins2keep -delete
That’s it: the replica was synced in merely 12 hours (instead of nine days). It runs fine and is free of any garbage.
Case #4. CockroachDB becomes slow
We encountered some performance issues after upgrading CockroachDB to version 20.2.x. They manifested themselves in a prolonged start of the application and an overall performance decrease of some query types. At the same time, we never noticed anything like this in CockroachDB 20.1.8.
The first thing we assumed is that issues are caused by network problems in the Kubernetes cluster. However, our initial assumption turned out to be false: the cluster network performed as expected.
Further examination showed that performance issues are related to the Keycloak application database in the CockroachDB cluster. So, we decided to turn on the logging of slow queries in CockroachDB. You can use the following commands to do this:
SET CLUSTER SETTING sql.log.slow_query.latency_threshold = '100ms';
SET CLUSTER SETTING sql.log.slow_query.internal_queries.enabled = 'true';
Logs showed that the PostgreSQL JDBC driver (used in the application) queries pg_catalog at the start, while the presence of the Keyсloak database heavily impacts the speed of executing these queries. We tried to make several copies of this database, and each added instance slowed down the pg_catalog performance:
I201130 10:52:27.993894 5920071 sql/exec_log.go:225 ⋮ [n3,client=<10.111.7.3:38470>,hostssl,user=<db1>] 3 112.396ms <exec> <"PostgreSQL JDBC Driver"> <{}> <"SELECT typinput = 'array_in'::REGPROC AS is_array, typtype, typname FROM pg_catalog.pg_type LEFT JOIN (SELECT ns.oid AS nspoid, ns.nspname, r.r FROM pg_namespace AS ns JOIN (SELECT s.r, (current_schemas(false))[s.r] AS nspname FROM ROWS FROM (generate_series(1, array_upper(current_schemas(false), 1))) AS s (r)) AS r USING (nspname)) AS sp ON sp.nspoid = typnamespace WHERE typname = $1 ORDER BY sp.r, pg_type.oid DESC"> <{$1:"'jsonb'"}> 1 <""> 0 <{ LATENCY_THRESHOLD }>
Here’s the same query with a loaded additional database:
I201130 10:36:00.786376 5085793 sql/exec_log.go:225 ⋮ [n2,client=<192.168.114.18:21850>,hostssl,user=<db1>] 67 520.064ms <exec> <"PostgreSQL JDBC Driver"> <{}> <"SELECT typinput = 'array_in'::REGPROC AS is_array, typtype, typname FROM pg_catalog.pg_type LEFT JOIN (SELECT ns.oid AS nspoid, ns.nspname, r.r FROM pg_namespace AS ns JOIN (SELECT s.r, (current_schemas(false))[s.r] AS nspname FROM ROWS FROM (generate_series(1, array_upper(current_schemas(false), 1))) AS s (r)) AS r USING (nspname)) AS sp ON sp.nspoid = typnamespace WHERE typname = $1 ORDER BY sp.r, pg_type.oid DESC"> <{$1:"'jsonb'"}> 1 <""> 0 <{ LATENCY_THRESHOLD }>
It looked like some CockroachDB system tables were responsible for slowing down the process.
When the customer confirmed the problem in the cloud-based CockroachDB installation as well, the root of the problem has become clear: the additional SQL functionality in version 20.2 causes all the performance issues. The thing is that the query plan for the pg_catalog schema in the new version significantly differed from that of 20.1.8. In other words, we have witnessed a typical regression case.
After getting all the facts, we fired up the GitHub issue. The developers undertook several attempts to reproduce the problem and were able to confirm it. They promised to solve it as soon as possible, actually implementing it in the 20.2.3 release. So, all things considered, our customer has decided to upgrade to the new version anyway since the bug currently manifests itself during the start only (it increases the startup time of the application instance).
Conclusion
As you can see, sometimes even clear and straightforward operations can lead to problems. But there is always a way out, right? We hope these stories will prove useful to our readers in their everyday operations. Stay tuned!

Comments