 SRE as a Service
 DevOps as a Service
 DevOps emergency
 Cloud & Kubernetes migration
 Infrastructure & CI/CD audit
 R&D and technology consulting
 Kubernetes support
 Solution for SaaS
 All services

Care to know how many users leverage incubating and graduated CNCF projects in production today? Does everyone use Prometheus? Which is more popular, containerd or CRI-O? Helm or Kustomize for K8s apps? Argo or Flux for GitOps? Which CI/CD platforms have more users? These charts were created based on the latest official survey from the CNCF and shed some light on the latest cloud-native ecosystem trends.
Introduction
At the beginning of last February, the CNCF Annual Survey 2022 results were announced. The survey was conducted from June 30 through September 27, 2022. It produced a massive breadth of informative stats based on 2,063 validated responses.
While CNCF published its results accompanied by anonymised data from Buoyant, Datadog, and Dynatrace, their summary didn’t include the full range of answers indicating the popularity of Open Source cloud-native projects.
At the same time, CNCF uploaded the raw data of the survey (and guidelines for processing it) to GitHub. I decided to fill in some gaps by creating some of the missing charts using their CSV and a bit of Python with its awesome Plotly graphing library. My primary interest was around the Open Source projects’ usage for various cloud-native needs.
First off, I made charts based on the original survey categories. However, there were two issues that arose with the generated bulky charts:
- The question worded as “Please indicate whether your organization is using in production or evaluating the following graduated CNCF projects” included 16 projects on a single chart;
- The same question for the incubating CNCF projects was even worse as it consolidated 35(!) items.
Therefore, I rearranged the data in a more illustrative and meaningful way. Please, don’t be too hard on this classification: I know the categories assigned to the projects are not always a perfect fit. I hope it will provide a good amount of value. For additional benefit, I will compare projects’ popularity with the stats available from the previous CNCF 2021 Survey.
NB: Please, note that the questions from this survey cover graduated and incubating CNCF projects only. Thus, don’t expect to see the usage stats for sandbox projects below.
Let’s dive into the stats we’ve got from CNCF and thousands of respondents!
Common categories
Networking
We’ll start with the CNCF networking-related projects. They will have CNIs (including the interface itself), Ingress controllers, service meshes, and more:
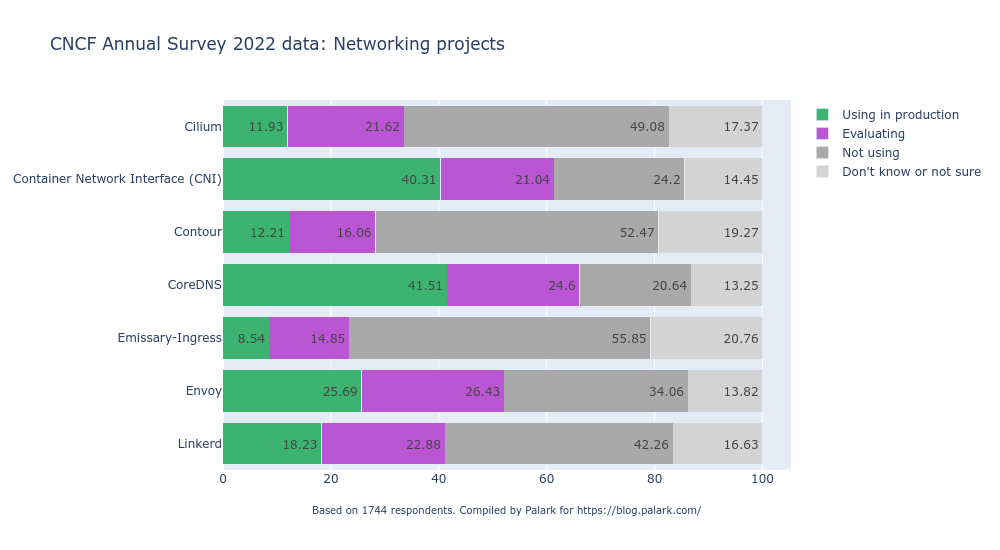
- No surprises for the excellent results exhibited by CNI itself (40.3% production users) and CoreDNS (41.5%): those are the basic technologies used today.
- As for service meshes, you may wonder where Istio is. It was accepted to the CNCF only in September 2022; thus, it was not an option to feature it at the moment of this survey. We’ll need to wait for the next one to evaluate its adoption rate.
- Some Istio users might have voted for Envoy, but this is anyone’s guess. In any case, this service proxy, which is used as a basis for many other projects, has demonstrated an impressive adoption rate: 25.7% in production compared to 21.9% a year before.
- Linkerd is not far away with a solid 18.2% production user base. However, it is a small dropoff from 19.6% in 2021.
- Just to add a bit more stats here, the latest Datadog report (updated in November 2022) showed a lesser than 3% adoption rate for Linkerd and a significantly higher (10%) for Istio.
- Contour ingress controller significantly improved its adoption rate, reaching 12.2% compared to 5.6% last year.
- Emissary-Ingress production users demonstrated a similar growth pace: from 3.9% in 2021 to 8.5% in 2022.
- 11.9% of respondents answered that they use Cilium in production. While we have no numbers from the year before (the project joined CNCF in October 2021), the number twice as large for “evaluating” users suggests huge potential. Personally, we have been using Cilium in production for a while — read our recent article here detailing our experience.
Storage, databases
Here goes the chart for storage-related projects where — awkward as it may be — I also include a few databases:
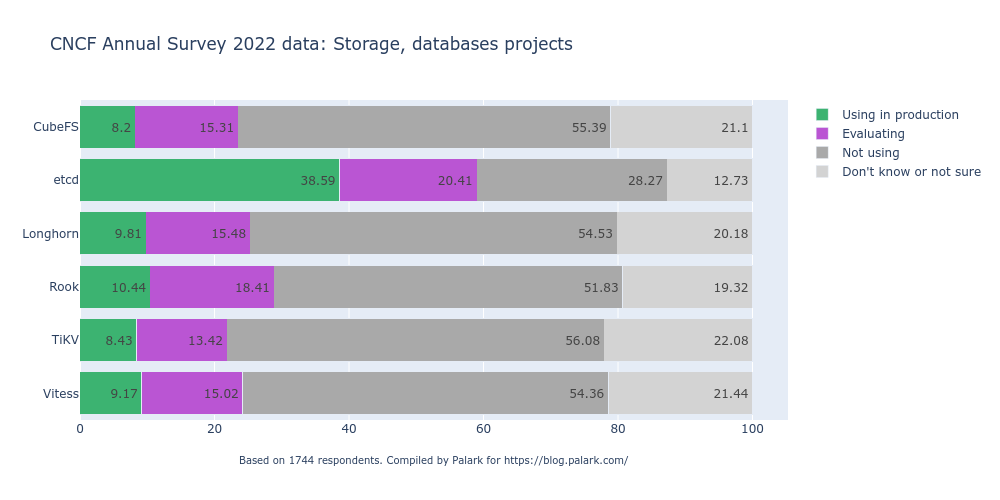
- As an essential part of Kubernetes, etcd naturally has a good adoption rate (38.6%). However, it still lags behind the rate for K8s itself or, say, CNI. Consequently, I wonder when the respondents actually decide whether they should mention the under-the-hood ingredients of their production K8s-based environments.
- Another key-value database and CNCF graduated project, TiKV, is used in production by 8.4% of users. It wouldn’t be fair to compare it with etcd. It’d make more sense to check out the difference between this number and the 2021 survey, which will definitely astonish us: TiKV’s users quadrupled compared to 2.1% of users a year ago.
- Vitess, a MySQL-compatible cloud-native database, has an even greater surprise in store: while it had only 1.5% of production users a year ago, its current rate has now reached 9.2%, a six-fold(!) explosion.
- Despite their formal maturity difference, storages Rook (a graduated project) and Longhorn (incubating since November 2021) have exhibited similar production adoption rates: 10.4% and 9.8%, respectively. It’s worth noting that Rook has achieved faster growth, as it had 7.6% a year ago, compared to Longhorn with its 7.7%.
- CubeFS file storage, which only just recently moved on to incubation (July 2022), has 8.2% of users in production. However, it’s omitted in the 2021 survey results for some reason.
Streaming, serverless, IoT
This category blends together five CNCF incubating projects:
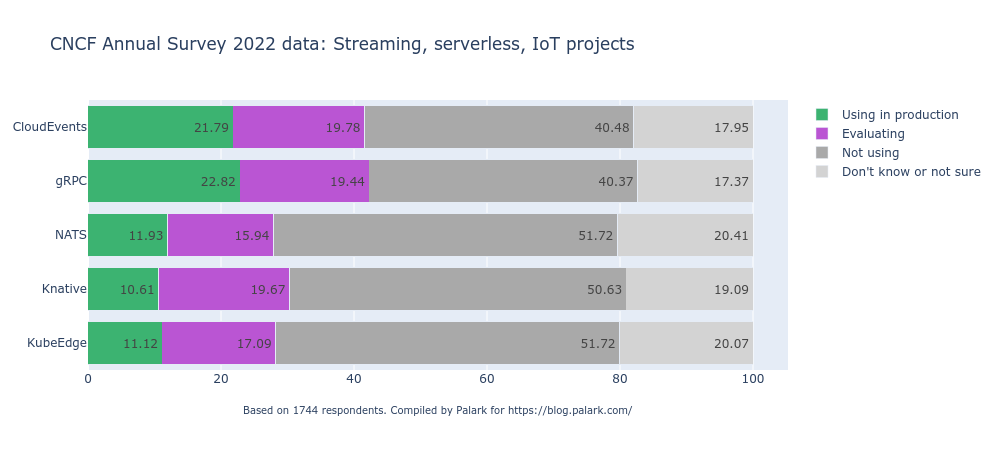
- gRPC framework for application communication has 22.8% of production users, a huge decline compared to 31.5% a year ago. Since the number of users who evaluate this technology also fell (from 22.9% to 19.4%), it seems to be a downward trend.
- CloudEvents specification for describing event data has trended in the complete opposite direction. It was adopted by a modest 6.8% of production users a year ago and now boasts a convincing share of 21.8%.
- 11.9% of respondents said they used NATS messaging technology in production. That’s a solid increase from 7.35% in 2021.
- Knative serverless platform is a recent addition to the CNCF projects (accepted in March 2022). It now exhibits a decent 10.6% usage share, with almost double the percentage when it comes to evaluating users. This is indicative of community interest, so seeing the numbers a little while later would be exciting.
- KubeEdge framework concentrated on edge networking features a similar number of production users (11.1%), more than two-fold growth compared to 4.8% a year before.
Kubernetes components and extensions
Container runtime & container registry
We have a clear winner for the container runtime and a prominent (yet actively pursued) leader in the container registry space:
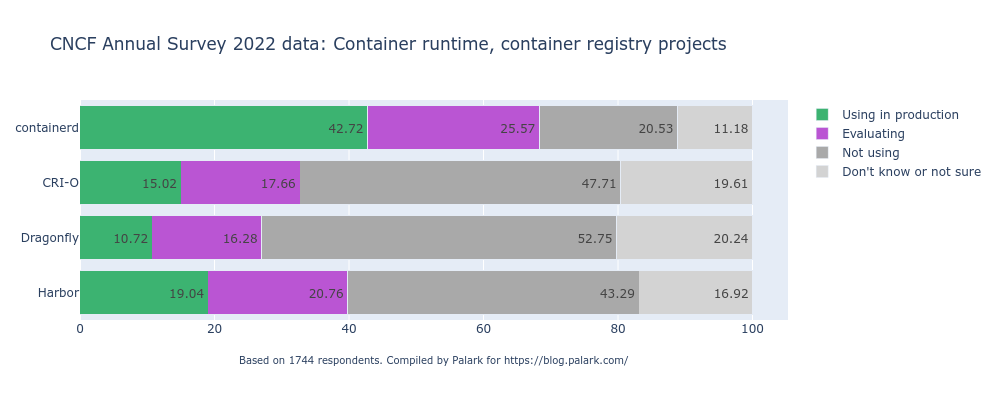
- Container runtimes:
- containerd is the most popular CRI backed, with 42.7% of production users and 25.6% more companies evaluating it. This is not a big surprise since this is also the runtime for the managed Kubernetes offerings of the three biggest cloud providers — namely, AWS EKS, Azure EKS, and Google GKE.
- Nevertheless, CRI-O enjoys a decent 15% user share, with 17.7% more evaluating it. The project applied for graduation in September 2022. It might take a while, but this move might add some confidence in choosing CRI-O among some users when it’s completed.
- As for container registries:
- Harbor, which is a graduated project, is more popular and enjoys a 19% user share. That’s an improvement over its 14.5% figure a year ago.
- Its only peer, Dragonfly, is currently incubating and is famous thanks to leveraging P2P technology. With 10.7% of production users for Dragonfly today, one has to take note of its spectacular 5-fold(!) growth over its figure last year of 2.2%.
Kubernetes orchestration and extensions
We’ve now made our way to Kubernetes itself. On the chart, the most widely known CNCF technology is accompanied by various tools that complement some of its capabilities:
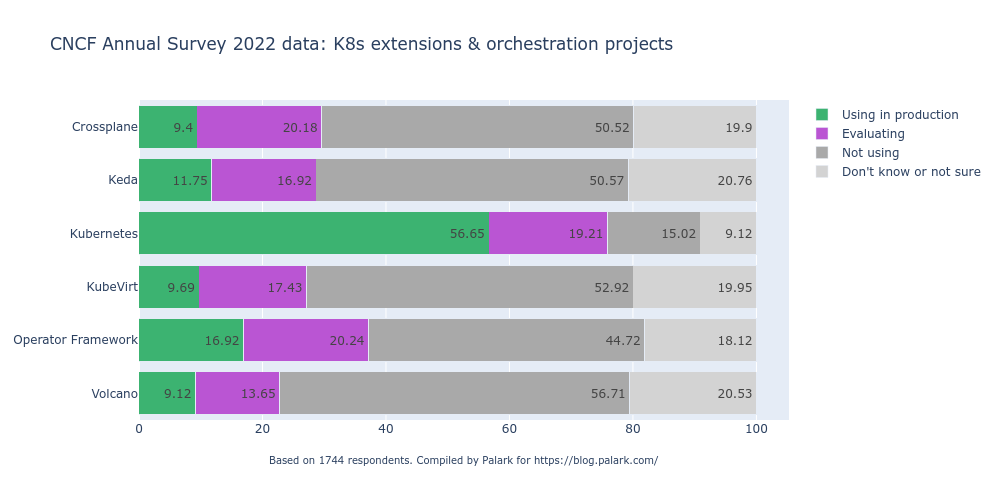
- It won’t be a huge surprise that Kubernetes exhibits the highest adoption rate among all CNCF projects. With 56.6% of respondents saying they use K8s in production, it is the only project that crossed the 50% threshold. One thing is even more remarkable here, though. The CNCF Survey a year ago exhibited a much higher share of Kubernetes users: 79.5%. This number is even higher than 2022’s figure for production + evaluating users combined. Can that be due to the great number of different respondents this time, e.g. a much broader audience? Do we have a lot of users who are disappointed? I feel this is something to contemplate…
- Operator framework goes second in this chart with 16.9% of users. For me, there seems to be quite a high percentage of those who develop their own operators to use in production, especially if we take into account the relative number of Kubernetes-in-production users. It is also a 4-fold growth from last year when it had only 3.82%.
- KEDA, which helps autoscale event-driven Kubernetes workloads, accounts for 11.8% of production users. Compared to just 4.7% a year ago, this also indicates a significant boost in adoption.
- KubeVirt, allowing K8s users to manage virtual machines in addition to containers, became an incubating project last April and increased its users share to 9.7% from 8.3% a year ago.
- Volcano, a batch system built on Kubernetes, took a similar route by incubating last April and getting more users. It proved even more successful in terms of tripling its production users from 3.1% a year ago to 9.1% now.
- Crossplane, aiming to “orchestrate anything” by building control planes on top of Kubernetes, has seen solid growth from 5.4% to 9.4%. Its huge share of evaluating users also hints at its high potential.
Development-focused
This group features the tools involved in CI/CD and/or used by cloud-native software developers:
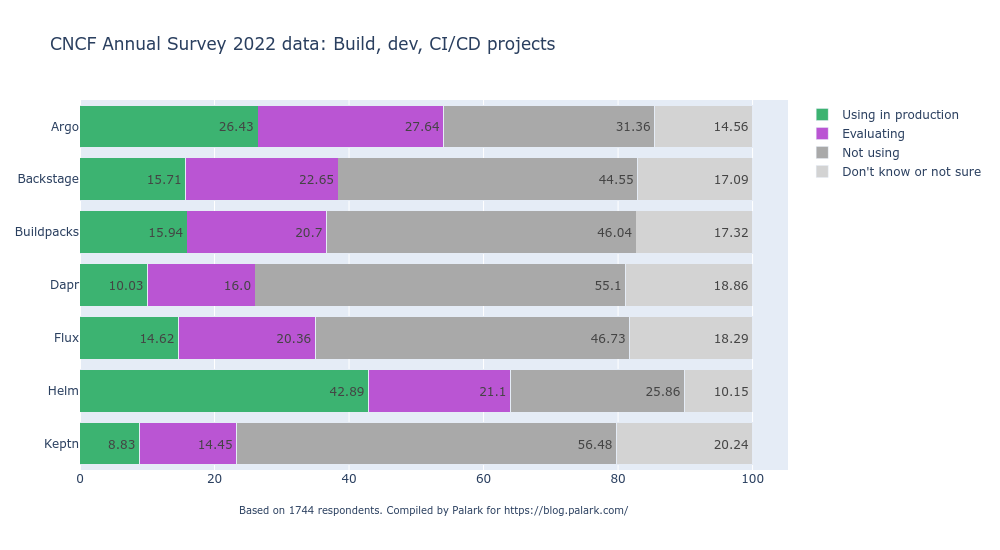
- Predictably, Helm is widely adopted in production environments (42.9%), whatever the respondents meant by this: whether using it for packaging apps or deploying them. Perhaps for the same reason that we saw Kubernetes usage drop in this survey, Helm also showed a steep decline from its 61% figure a year ago.
- Argo is another prominent project here, with an impressive 26.4%. It had 21.8% production users in 2021, so we can see a steady increase in interest. The recent graduation of Argo (December 2022) will likely improve its adoption rate even further.
- Its famous GitOps-flavoured counterpart that also saw recent graduation, Flux, has a bit more than half the amount of Argo production users: 14.6%. It was 11.5% last year, so we see a similar popularity growth in this case.
- Buildpacks demonstrated double growth peaking at a decent 15.9% nowadays compared to 7.3% a year ago.
- Backstage, a platform for building developer portals, showed a similar level of production adoption, with 15.7% of respondents using it in production. This project had only 5% of users a year ago, and it became incubating in March 2022 — therefore, I have no doubt it will continue increasing its user base.
- Dapr, which focuses on building and running distributed applications, accounts for 10% of production users. It only became a CNCF project in 2021, so we don’t have any previous stats to compare that to.
- Keptn, providing application life-cycle orchestration, progressed with incubating in July 2022 and reached 8.8%, more than doubling its production users from 3.9% a year ago.
The CNCF 2022 Survey had other questions related to the Kubernetes-related CI/CD ecosystem, which are worth noting to gain a bigger picture of the most popular tools & services. The first one (Q20) was about a preferred method for packaging Kubernetes applications:
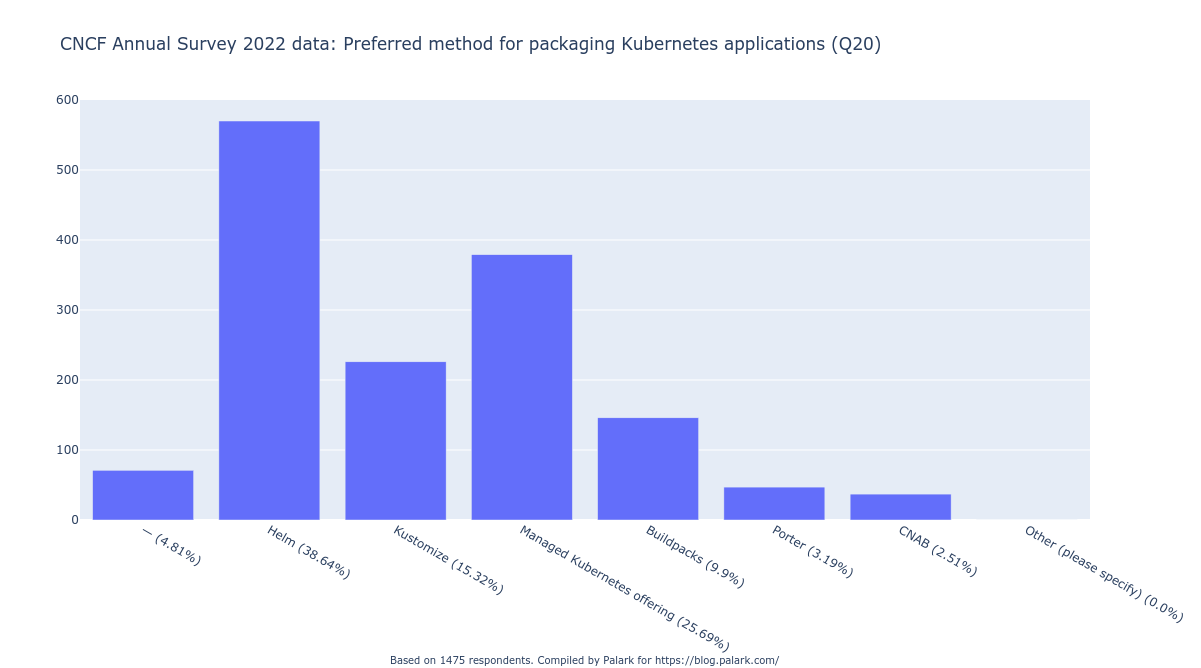
We can see that Helm (38.6%) has a predictably significant advantage over Kustomize (15.3%) when it comes to packaging and distributing software for K8s. What appears more interesting to me is the considerable number of users (25.7%) preferring a relevant managed Kubernetes offering for that. Buildpacks project is used by 10% of respondents, which is a prominent share, too.
Another question (Q43) concerned any tools (not just CNCF projects) the respondents’ organisations use in CI/CD:
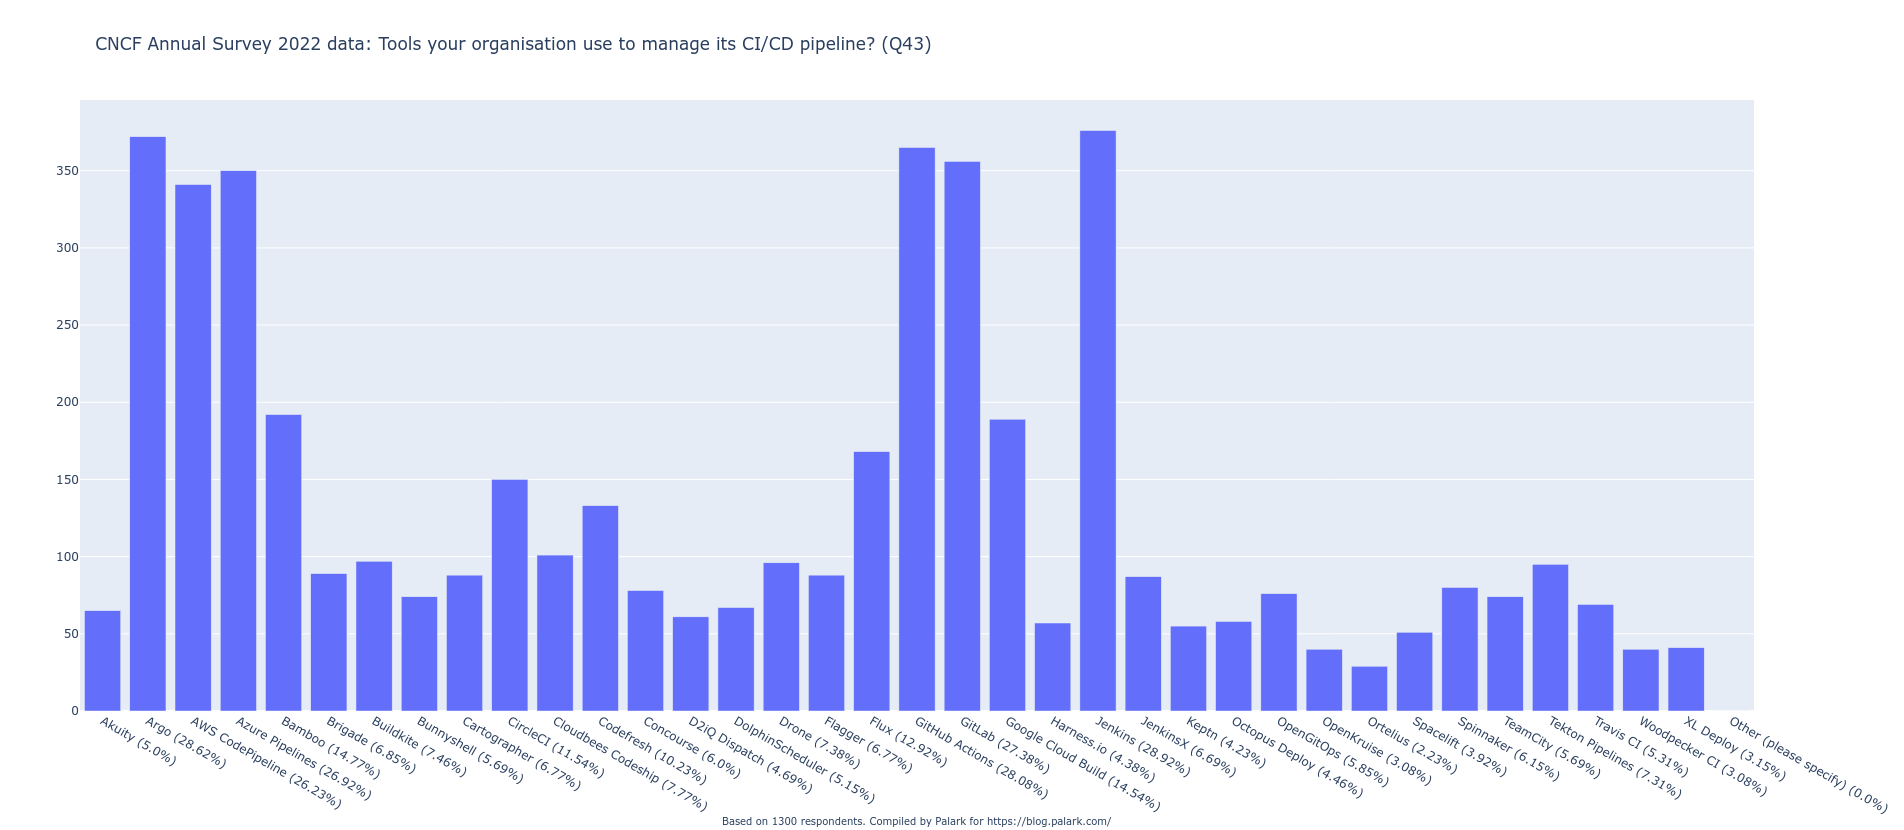
Here, we can see cloud-native users’ preferences in terms of various CI/CD-related tools and SaaS offerings.
Most widely used cloud provider CI/CD solutions
- Azure Pipelines (26.9%);
- AWS CodePipeline (26.2%);
- Google Cloud Build (14.5%).
Most popular [other] CI & CD systems/platforms
- Jenkins (28.9%);
- GitHub Actions (28%);
- GitLab (27.4%);
- Bamboo (14.8%);
- CircleCI (11.5%);
- Codefresh (10.2%);
- Cloudbees Codeship (7.8%);
- Buildkite (7.5%);
- Drone (7.4%);
- Tekton Pipelines (7.3%);
- Jenkins X (6.7%);
- Spinnaker (6.2%);
- Concourse (6.0%)
- TeamCity (5.7%);
- Akuity (5.0%).
Most adopted GitOps tools
- Argo (28.6%);
- Flux (12.9%) — by the way, its Flagger has 6.8% on its own;
- OpenGitOps (5.9%).
SRE and more
Observability
Numerous CNCF projects address observability issues, assisting SRE and DevOps engineers in monitoring and obtaining essential data, such as metrics, logs, traces, etc., to ensure reliable and efficient operations. Here’s what the latest cloud-native users’ survey demonstrates in this regard:
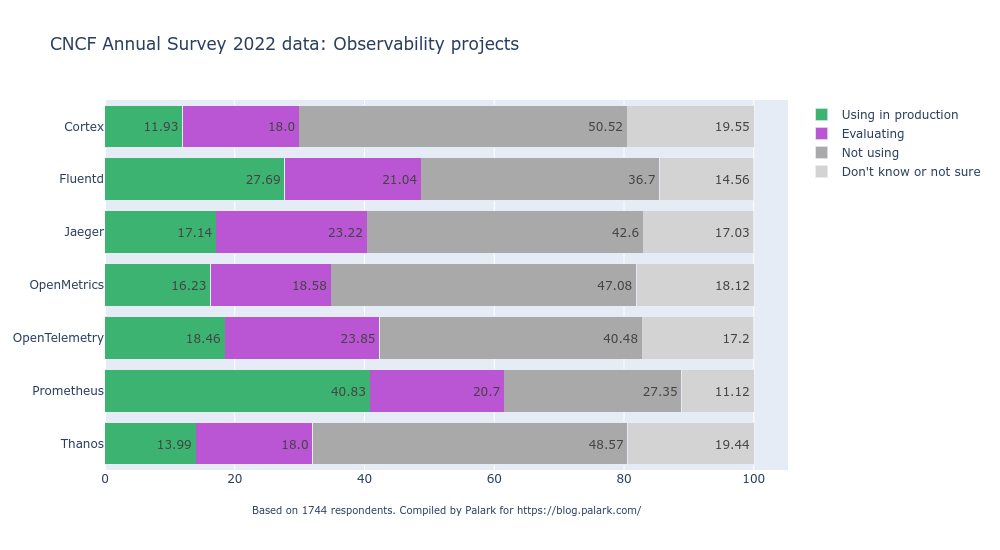
- I bet no one would be surprised to see Prometheus, the second graduated project of the CNCF, leading this chart with 40.8% of production users. However, similar to what we’ve seen with Kubernetes and Helm, the Prometheus adoption rate significantly fell compared to its figure in the survey a year ago: then 65%.
- Three other Prometheus-related projects are:
- The long-term storage, Cortex, with 11.9% of users relying on it in production. That is a solid increase from last year’s 5.6%. Add 18% of evaluating users and you have another promising CNCF project to be aware of.
- Thanos, providing another way to gain long-term storage for Prometheus, has an even better 14% adoption rate. It is pretty similar to last year’s figure when it had 13%.
- The OpenMetrics specification, working on standardising the Prometheus format, accounted for 16.2% of users. That’s a rapid improvement from 7.1% of users a year ago. This project became incubating in February 2022.
- Fluentd, the well-known log collector, exhibits a good 27.7% adoption in production. That is a decline from 35.3% a year ago, though.
- OpenTelemetry was recently called the second most actively developing CNCF project. Its current adoption rate was good already (18.5% production users this year, 13.9% a year ago), but I expect it to grow further still — it is just not an overnight process, though.
- Jaeger, the tracing platform we all know, is used by 17.1% of respondents. It is close to their figure a year ago (16%); thus, it seems to be another project that is gradually being adopted by the cloud-native community.
Chaos engineering
The art of chaos engineering has been a hot topic for SRE engineers over the last few years. How is the adoption of its most mature CNCF projects going?
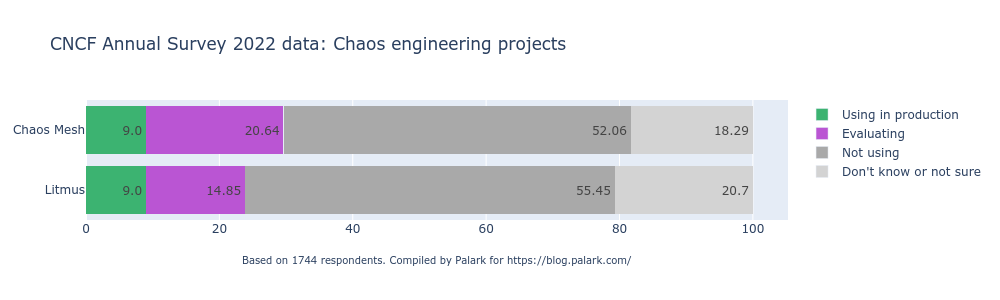
- Interestingly, Chaos Mesh and Litmus show a completely equal number of production users: 9%. Another similarity is that both projects became incubating at the beginning of 2022 (see this January announcement for Litmus and the February post for Chaos Mesh). Chaos Mesh had a better share a year ago (7.1% vs 3.7%) but boasts a better share of cloud-native users who are currently evaluating the technology (20.6% vs 14.9%). Quite an interesting race, wouldn’t you say?
If you’re interested in seeing various Open Source tools for chaos engineering in action, have a look at our overview published a couple of years ago.
Security
Last but not least category lists various security-related CNCF projects. Sadly, none of them could reach 20% of production users. At the same time, the upward popularity trend for these technologies is promising:
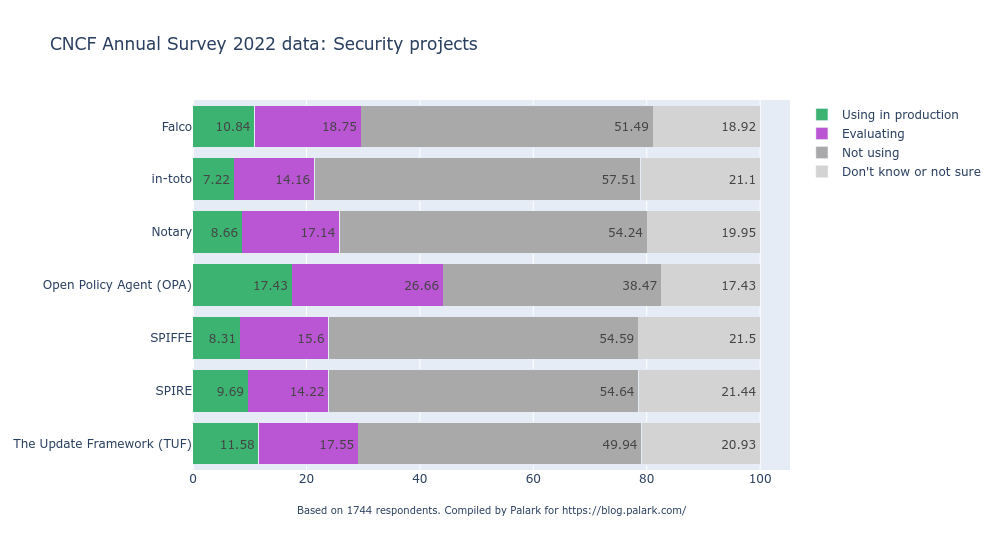
- Open Policy Agent (OPA), with its 17.4% adoption rate, is the leader on this chart. It also shows an impressive share of evaluating users (26.7%) and gradual growth from its 14.8% figure a year ago.
- The Update Framework (TUF), focused on securing software updates, has 11.6% of production users — an astonishing increase from a mere 2.1%.
- Notary, which is based on TUF, shows a more modest 8.7% adoption. At the same, it is growing pretty fast, considering that it had just 3.9% a year ago.
- Falco, the runtime security tool, is used in production by 10.8%. Compared to 6.9% a year ago, it is indubitably a positive trend.
- SPIRE and SPIFFE just recently graduated (September 2022). They show similar adoption rates (9.7% and 8.3%, respectively) and more than two-fold growth (from 3.6% and 3.8%, respectively).
- in-toto, a framework for protecting supply chain integrity, moved to the CNCF incubator in March 2022. Its 7.2% adoption rate today is another good sign for the industry.
Top 10 most widely used CNCF projects
If you are also curious about the most popular CNCF graduated & incubating projects, here are the overall adoption rate leaders:
- Kubernetes — 56.7% (using in production) + 19.2% (evaluating);
- Helm — 42.9% + 21.1%;
- containerd — 42.7% + 25.6%;
- CoreDNS — 41.5% + 24.6%;
- CNI — 40.3% + 21%;
- Prometheus — 40.1% + 20.7%;
- etcd — 38.6% + 20.4%;
- Fluentd — 27.7% + 21%;
- Argo — 26.4% + 27.6%;
- Envoy — 25.7% + 26.4%.
Out of this top 10, only one project is still incubating — CNI. Argo was also incubating at the moment of the survey, but, as mentioned above, it became graduated at the end of last year.
Based on that, we can say there definitely is a correlation between the CNCF-approved level of project maturity and its usage share. Which comes first? Actually, the graduation criteria assume the project must have a solid list of adopters — in addition to a healthy community which is required as early as at the incubating level.
And here go the three last fun charts. Top 3 currently evaluated CNCF projects:
- Argo — 27.6%;
- Open Policy Agent — 26.7%;
- Envoy — 26.4%.
Top 3 growing CNCF projects (production users compared to the data from the CNCF survey a year ago):
- Vitess (from 1.5% to 9.2%);
- TUF (from 2.1% to 11.6%);
- Dragonfly (from 2.2% to 10.7%).
Top 3 declining CNCF projects:
- Prometheus (from 65% to 40.8%);
- Helm (from 61% to 42.9%);
- Kubernetes (from 79.5% to 56.6%).
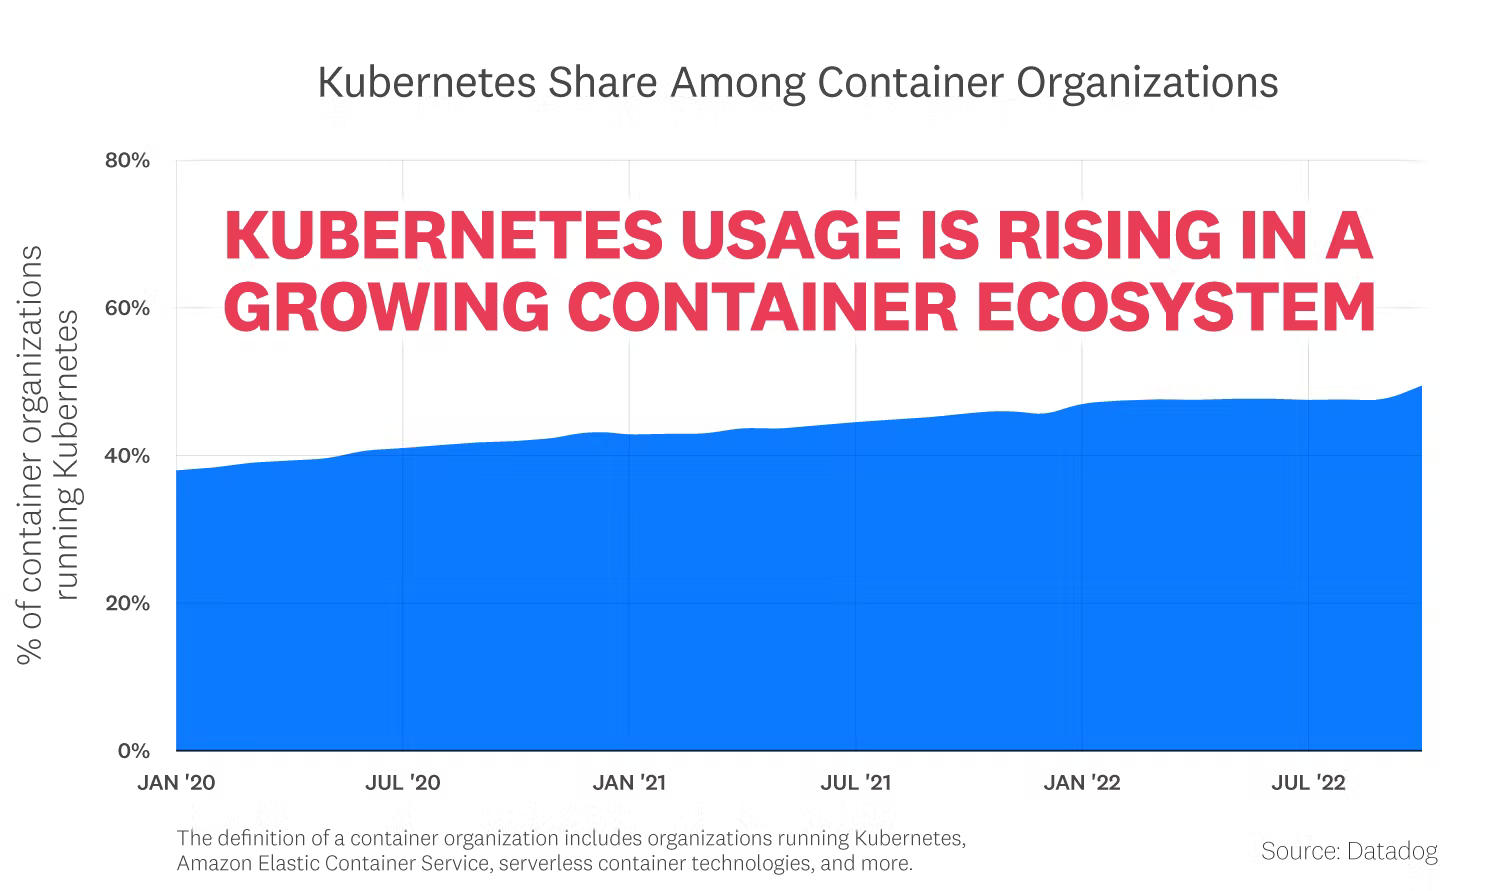
Is this downward trend for the most well-known cloud-native projects real? As I mentioned above, for Kubernetes, there is more likely to be another reason related to the survey respondents. The latest Datadog report insists that Kubernetes usage has been consistently rising over the past few years. We see it even in the enterprise market (DZone report). We are also aware of an ongoing trend for organisations to embrace containers in general (Statista).
Is it the same story for Prometheus & Helm? I think there might be one more reason — the rise of other tools used to implement their functionality. Since cloud-native ecosystem becomes more diverse and other technologies are maturing, that sounds quite convincing to me. Nevertheless, the projects from this “declining” Top 3 are still the actual kings in what they do. There is just some space for trial and error with other approaches as well, which is beneficial for everyone.
Afterword
Hopefully, this information detailing which Open Source projects hosted at CNCF tend to be the most popular in today’s cloud-native ecosystem has provided some value for you. While it’s always fun to read the numbers and compare them, they are still just stats. It’s up to you to decide how this newly acquired knowledge will affect your strategy and vision for your cloud-native applications and infrastructure.
P.S. You can find the Python script I used to generate all those charts on GitHub. It was in no way meant to be universal, but you can use and adjust it to suit your needs.

Comments