 SRE as a Service
 DevOps as a Service
 DevOps emergency
 Cloud & Kubernetes migration
 Infrastructure & CI/CD audit
 R&D and technology consulting
 Kubernetes support
 Solution for SaaS
 All services

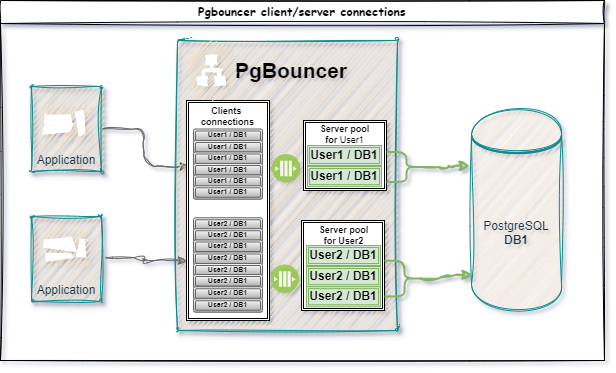
PgBouncer is a lightweight connection pooler for PostgreSQL that optimizes database performance by efficiently managing connections. At Data Egret, we have been using it for numerous customers to ensure reliability and reduce resource consumption. Before we dive deeper into monitoring, let’s quickly revisit the key aspects of how PgBouncer works.
PgBouncer handles connections between clients and the database server using a connection pool. The client connects to PgBouncer as if it were a regular PostgreSQL database, and then all its requests are routed through the pool of server-side connections that PgBouncer establishes and manages on its own.
The pool size, which refers to the server-side connections, is determined by the pool_size parameter. This can be set globally via default_pool_size at the database level in the [databases] section or for each user in the [users] section. For more information about these and other configuration options, refer to the PgBouncer configuration documentation.
It’s important to note that pool_size is applied separately for each user, meaning each username has its own connection pool.
One of the main tasks in administering PgBouncer is monitoring, which helps identify and fix potential issues quickly, preventing serious failures and system downtime. Setting up alerts and monitoring allows you to detect if PgBouncer is becoming a bottleneck in your database cluster, as well as identify other critical situations.
The Odarix monitoring system offers powerful tools for collecting data from various services, including PgBouncer. It provides visualization and analysis of metrics, enabling you to monitor PgBouncer’s performance effectively. This lets you set up alerts for critical situations and respond quickly to potential issues.
Key PgBouncer metrics
Here are some of the essential metrics Odarix collects and monitors for PgBouncer:
1. System process metrics:
- Maximum CPU usage by a single thread (
process.max_cpu_percent_per_thread); - CPU usage by PgBouncer processes (
process.cpu.*).
These metrics allow us to monitor PgBouncer’s CPU resource consumption. Since PgBouncer operates in a single-threaded mode, keeping an eye on these metrics is essential for preventing potential CPU bottlenecks. If you’re interested in more details on handling such situations, check out this guide from Percona.
2. PgBouncer statistics (from SHOW STATS):
- Total number of SQL requests (
pgbouncer.total_requests); - Total SQL query execution time (
pgbouncer.total_query_time); - Total number of transactions (
pgbouncer.total_xact); - Server connection wait time (
pgbouncer.total_wait_time).
Odarix also provides detailed metrics for monitoring server and client connections in PgBouncer, including the number of active connections, connection wait times, and other critical parameters that help troubleshoot performance issues.
Its preconfigured charts leverage those metrics and offer a foundation for analyzing PgBouncer’s performance and operation. You can use them as a basis for creating custom visualizations and adjusting metrics to meet the specific needs of your application.
For a more detailed description of all metrics, their meanings, and the data sources they originate from, refer to the Odarix documentation, which thoroughly explains how the monitoring system interacts with PgBouncer and which metrics are used.
Types of metrics in Odarix
When analyzing metrics, remember that some are cumulative, and others show the current state at the time of collection:
- Cumulative metrics, like those from
SHOW STATS, act as counters, increasing over time. For example, total transaction or request counts accumulate continuously. To get the result for a specific period, subtract the previous value from the current one. - Current state metrics from
SHOW POOLSandSHOW CLIENTSprovide data at the time of collection, so they may not always reflect the full picture and can contain inaccuracies. In other words, if you see 0 waiting clients on the graph, it doesn’t mean there were none before the data was collected.
When analyzing graphs and setting up triggers, always keep this aspect in mind to ensure accurate interpretation and effective monitoring.
A practical example of monitoring
To demonstrate the monitoring capabilities of PgBouncer using Odarix, let’s analyze one scenario with high loads on the connection pool.
We will simulate a situation where the number of connections exceeds the configured pool_size value. In our test, the pool_size limit is set to 20. We will run several tests with different numbers of connections to PgBouncer and observe how this is reflected in the graphs.
A series of three test runs with pgbench using different numbers of connections — 15, 25, and 50, respectively, in read-only mode (-S):
 pgbench -U postgres -p 6432 -h localhost -n -c 15 -T 300 -P 60 -S -v testdb
 pgbench -U postgres -p 6432 -h localhost -n -c 25 -T 300 -P 60 -S -v testdb
 pgbench -U postgres -p 6432 -h localhost -n -c 50 -T 300 -P 60 -S -v testdb
Test results analysis
In the first test with 15 connections, where the number of connections does not exceed the pool_size, you won’t see significant spikes on the graphs below. However, starting from the second test and onwards, when the number of connections exceeds the pool_size, you will notice sharp changes on certain graphs, indicating an overload of the connection pool. Let’s take a closer look:
1. Average query time
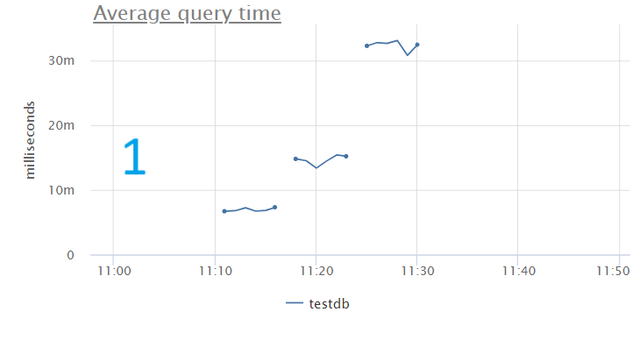
The graph shows that the average query time gradually increases as the number of connections grows. This increase in time is due to waiting for a free spot in the connection pool, which indicates a higher load on the pool and a drop in performance.
2. Percentage of time spent waiting
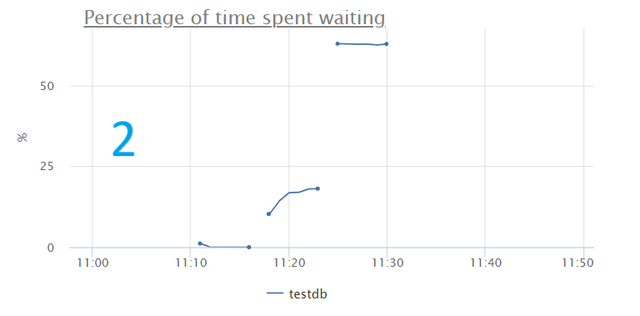
The percentage of time clients’ queries spend waiting for a free server connection sharply increases, reaching over 60% under heavy load. This negatively impacts overall performance.
3. Pool utilization peak
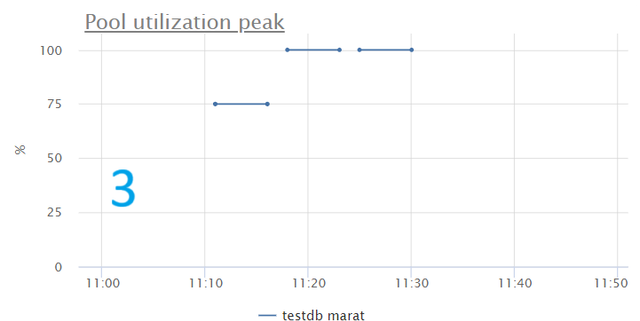
The graph shows that the connection pool is being used to its total capacity. This confirms that the pool is overloaded and suggests reconsidering its size.
4. Server connections by user
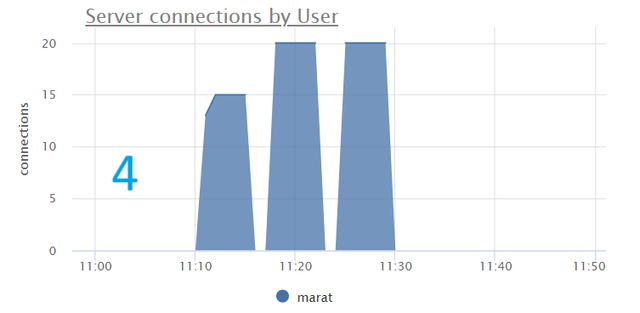
Although we cannot say with certainty that the maximum number of connections has been reached, the plateau on the graph may indirectly indicate that the pool_size limit has been reached. Additionally, it is necessary to monitor that the total sum of all server connections does not exceed the max_connections setting in the database.
5. Waiting clients
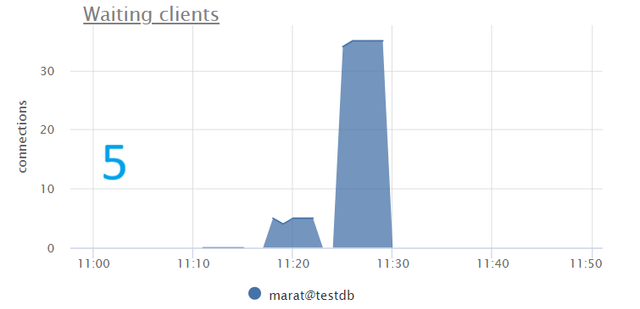
The graph shows a significant increase in clients waiting for free connections as the number of connections rises to 25 and 50. This is a clear sign of connection pool overload.
6. CPU utilization
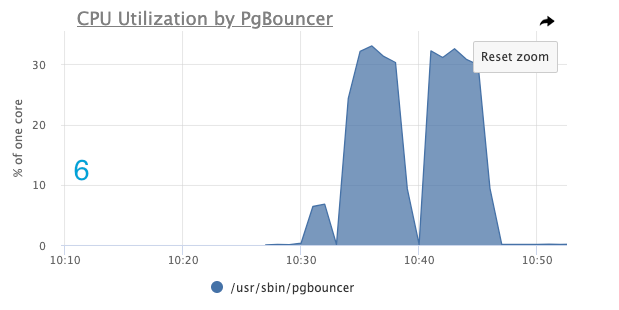
The graph above shows that during all stages of testing, CPU usage by PgBouncer processes did not exceed 30%, indicating stable performance without CPU bottlenecks.
Triggers and alerts
To effectively monitor PgBouncer using Odarix, setting up alerts for several key metrics is essential to help prevent connection pool overloads and other critical issues. Here is a basic set of helpful alerts:
1. PgbouncerMaxClientsConnections
This alert should be configured to monitor the maximum number of client connections allowed in PgBouncer. If clients exceed the allowed number, new connections won’t be possible.
expression: sum_by(source_hostname, metric(name='pgbouncer.clients.count'))
threshold: ">=XXX" # max_client_conn in pgbouncer.conf
severity: "critical"
message: "[%(source_hostname)s] pgbouncer clients connection is reaching the limit of XXX"
resolve_after: YYY # resolve after YYY seconds of OK
2. PgbouncerMaxServerConnections
We also want to track the total number of server connections in PgBouncer relative to the max_connections setting in PostgreSQL. If this value reaches the maximum, it can lead to the inability to service new requests and result in clients waiting for available server pool connections. You can create multiple versions with different thresholds and alert levels for this specific alert, such as 70% and 90% of max_connections.
expression: sum_by(source_hostname, metric(name='pgbouncer.server_connections.count'))
threshold: ">=XXX" # max_connections in postgresql.conf
severity: "warning/critical"
message: "[%(source_hostname)s] pgbouncer server connection is reaching the limit of XXX"
resolve_after: YYY # resolve after YYY seconds of OK
3. PGBouncerHighClientNumWait
This alert monitors the number of clients waiting for a server connection in PgBouncer. The presence of such clients may indicate potential issues with the connection pool’s capacity, which can lead to delays in processing requests.
expression: win_min(120, sum_by(source_hostname, database, user, n2z(metric(name="pgbouncer.clients.count", state="waiting"))))
threshold: ">10" # replace 10 with your desired threshold value, indicating the number of waiting clients
severity: "warning/critical"
message: "[%(source_hostname)s] pgbouncer waiting clients %(user)s@%(database)s > 10"
resolve_after: 180 # resolve after 180 seconds of OK
4. PGBouncerHighClientWaitTimePercentage
We will track the percentage of time spent waiting for a free server connection in PgBouncer. As mentioned in the previous point, a high waiting percentage indicates potential pool capacity issues. The difference is that PGBouncerHighClientNumWait is a current state metric type, while PGBouncerHighClientWaitTimePercentage is a cumulative metric type, making it more precise.
expression: win_sum(120, sum_by(source_hostname, database, counter_rate(metric(name="pgbouncer.total_wait_time")))) / win_sum(120, sum_by(source_hostname, database, counter_rate(metric(name="pgbouncer.total_query_time")))) * 100
threshold: ">=XXX" # replace XXX with the threshold value, for example, 10 (meaning queries are spending more than 10% of their time waiting)
severity: "warning/critical"
message: "[%(source_hostname)s] pgbouncer queries on %(database)s are spending %(threshold)s%% of time waiting"
resolve_after: YYY # resolve after YYY seconds of OK
5. PGBouncerHighCPUUsage
This alert monitors the CPU consumption of PgBouncer processes. High CPU usage may indicate performance bottlenecks or issues with the connection pool handling, which can degrade PgBouncer’s ability to manage connections efficiently.
expression: sum_by(source_hostname, metric(name="process.cpu.*", process="pgbouncer"))/XXX # replace XXX with a number of pgbouncer processes
threshold: '>= YYY' # replace YYY with a threshold, such as a percentage (e.g., 80% of CPU usage)
severity: 'warning'
message: "[%(source_hostname)s] pgbouncer CPU usage is %(threshold)s%%"
resolve_after: ZZZ # resolve after ZZZ seconds of OK
These alerts are essential for early detection of potential issues, preventing connection pool overloads, and ensuring your database remains stable under heavy load.
Conclusions
Watching PgBouncer using Odarix provides a comprehensive view of how connection pool management impacts the overall performance of your PostgreSQL database. By carefully monitoring key metrics such as average query time, pool utilization, and the number of waiting clients, it becomes clear that exceeding the configured pool_size can lead to significant performance degradation.
The experimental data from Odarix confirms these observations and highlights the importance of proactive monitoring and timely adjustments. As we’ve seen, an overloaded connection pool can severely affect user experience by increasing wait times and reducing system efficiency. Therefore, it’s crucial to regularly review and adjust the pool_size setting based on the monitoring insights, ensuring your database operates smoothly even under high loads.
About Data Egret
This blog post was written by Data Egret at the request of Odarix.
Data Egret is a PostgreSQL consultancy that helps companies achieve high availability for business-critical applications by supporting PostgreSQL databases—covering everything from the architectural aspects of new product development to the roll-out of new clusters, configuration tuning, and database optimization.
Data Egret is a significant contributing sponsor to PostgreSQL, actively involved in the community, and regularly contributes to the development of PostgreSQL. This deep engagement allows them to guide clients in their open-source journey as they transition from proprietary solutions.

Comments