Have you already heard about K9s? It is a terminal-based UI to manage Kubernetes clusters that aims to simplify navigating, observing, and managing your applications in K8s. K9s continuously monitors Kubernetes clusters for changes and provides shortcut commands to interact with the observedsources.
This Open Source project is written in Go and has been in existence for almost 2 years: the first commit was made on February 1, 2019. It boasts about 10,000 stars on GitHub and 80+ contributors. Well, let’s take a closer look at K9s and see what you can do with it.
Installing and getting started
Running as a Docker image is the easiest way to start using K9s that functions as a client application that connects to your Kubernetes clusters:
docker run --rm -it -v $KUBECONFIG:/root/.kube/config quay.io/derailed/k9sThere are ready-to-install packages available for some Linux distributions and other OSes. Also, there is a binary that is not tied to any specific Linux implementation:
sudo wget -qO- https://github.com/derailed/k9s/releases/download/v0.24.1/k9s_Linux_x86_64.tar.gz | tar zxvf -  -C /tmp/
sudo mv /tmp/k9s /usr/local/bin
K9s is free of any clear-cut requirements for the Kubernetes cluster. However based on public feedback, the application is compatible with older versions of Kubernetes (e.g., 1.12) as well.
The application uses the standard .kube/config file (the same way kubectl is working).
Navigating
By default, K9s starts with the standard namespace that is set as the context. In other words, if you execute the command kubectl config set-context --current --namespace=test, then you will see the namespace called test (see below for more information on setting contexts/namespaces).

You can switch to the command mode by clicking on “:”. In this mode, you can control k9s using shortcut commands — for example, enter :sts to view the list of StatefulSets in the current namespace:

Here are the commands for some other Kubernetes resources:
:ns— Namespaces;:deploy— Deployments;:ing— Ingresses;:svc— Services.
To display the full list of resource types available for viewing, use the :aliases command.
You can click on “?” to view the list of hotkeys available in the active window.
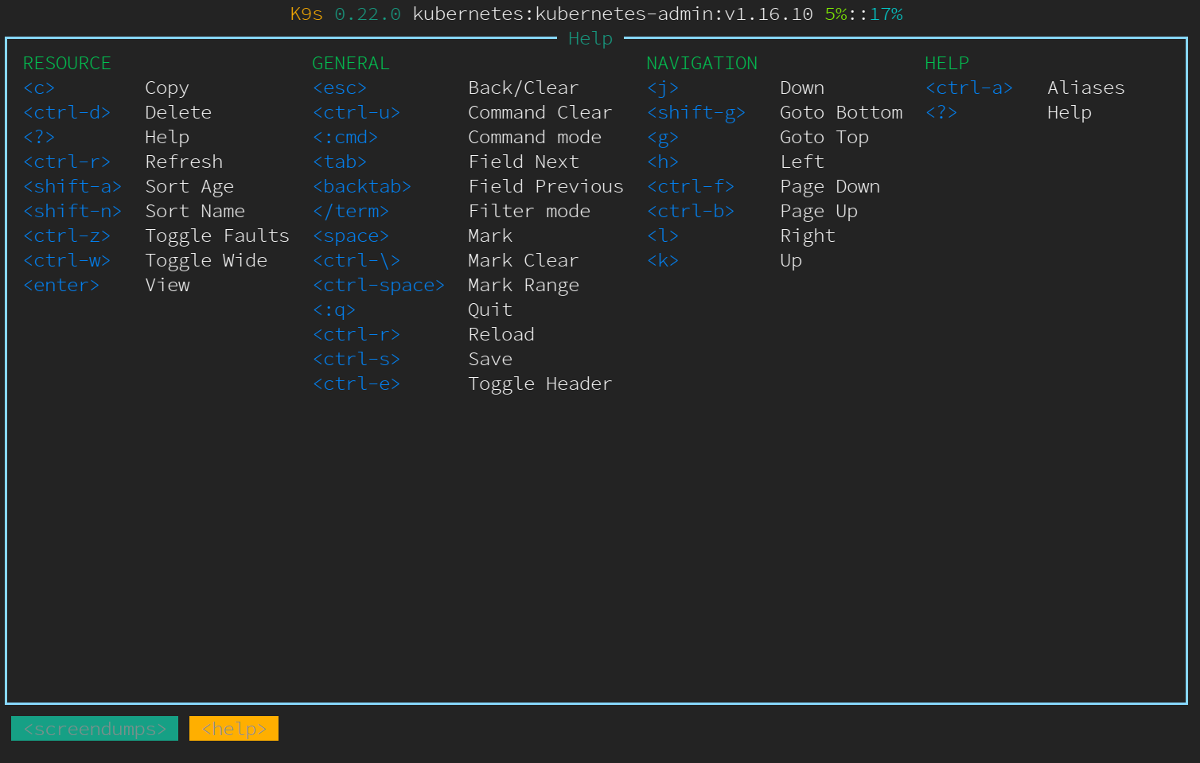
Also, there is a search mode — enter “/” to open it. It is intended for searching the contents of the current “window”. Suppose, you have entered :ns to browse a list of namespaces. Now, if you have a large number of namespaces, you can simply enter /mynamespace to search for the required namespace and avoid excessive scrolling.
To perform a label search, you can select all pods in the target namespace and then enter, for example, / -l app=whoami. You will get a list of pods containing this label:

Search works in all types of “windows”, including viewing logs, YAML manifests, and describe’s of resources — for more information, see below.
OK, so how do you usually navigate here?
First, select the context using the :ctx command:

Then you can browse namespaces with :ns and find the desired one using /<your namespace> (test in our case).
Select the resource you are interested in (say, a StatefulSet) to view the related details: how many pods are running and brief information about them.

Enter :pod to view pods. In the case of ConfigMaps (enter :cm to display the list of CM objects), you can select the CM of interest and press the “u” key — K9s will display the list of resources that use it.
The XRay view is another convenient feature of K9s. You can start this mode by entering :xray RESOURCE and… I’d better show it in action. Here is how it looks in the case of StatefulSets:

And here is an example of this mode in the case of a Deployment with Ingress:

Working with resources
You can get a YAML manifest for any resource or describe it by pressing the corresponding keys: “y” and “d”, respectively. The list of basic commands does not end here: their complete set, along with key bindings, is conveniently displayed in the interface header (you can hide it by pressing CTRL + e).

You can edit any resource (after selecting it) by pressing “e” — this command opens the text editor specified by the environment variable (export EDITOR=vim).
And here is the detailed resource description (describe):
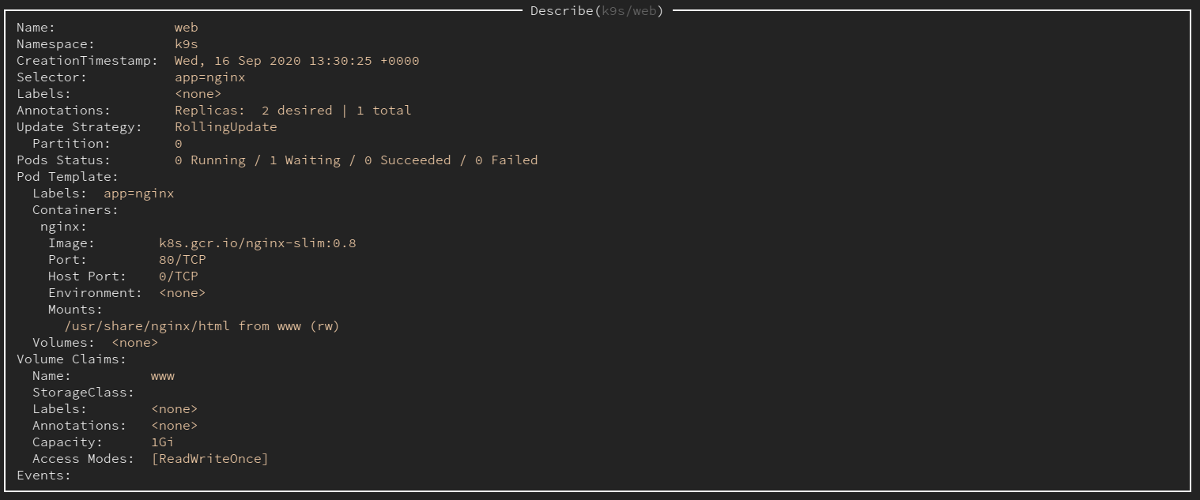
You can save this output (as well as the YAML manifest of the resource) by pressing a well-known CTRL + s key combination. Then K9s will show a message with the location where the output is saved:
Log /tmp/k9s-screens-root/kubernetes/Describe-1601244920104133900.yml saved successfully!You can use these backups to restore resources (after removing system labels and annotations). To do this, go to the containing directory (:dir /tmp), select the file, and apply it.
As a side note, you can roll back to the previous ReplicaSet at any time if there are problems with the latest one. For this, select the needed RS (enter :rs to list them):

… and perform a rollback by pressing CTRL + l. You should get a notification that the rollback is successful:
k9s/whoami-5cfbdbb469 successfully rolled backTo scale the number of replicas, press the “s” (scale) key and enter the desired number of instances:

Also, you can enter into any container: select the pod, press the “s” (shell) key, and choose your container.
Other features
Of course, you can browse logs (press “l” at the selected resource). And you do not have to hit Enter repeatedly to refresh the list: just press “m”, and new messages will be displayed automatically.

You can also select a time range for displaying logs:
1— all logs over the last minute;2— over 5 minutes;3— over 15 minutes;4— over 30 minutes;5— over 1 hour;0— over the entire lifetime of the pod.
A special Pulse mode (:pulse) displays general information about the Kubernetes cluster:
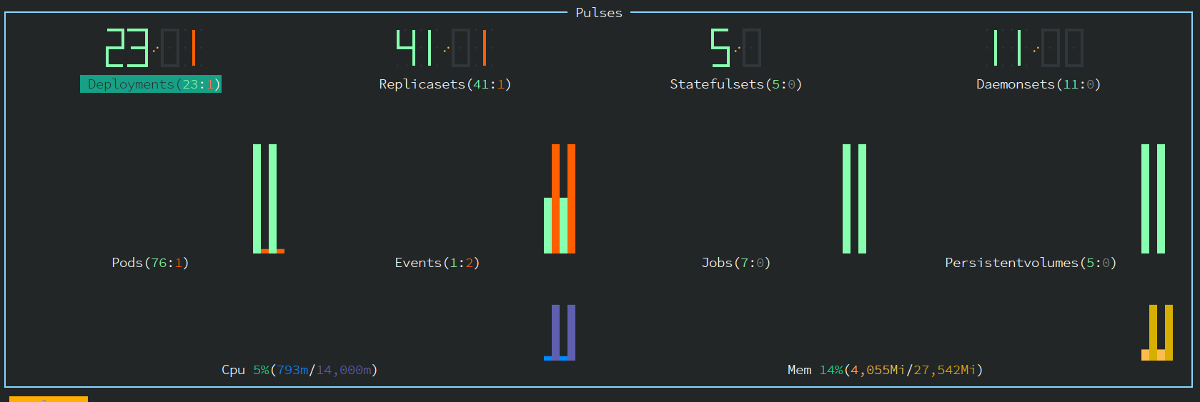
In this mode, you can check the number of resources and their state (those in the Running state are shown in green).
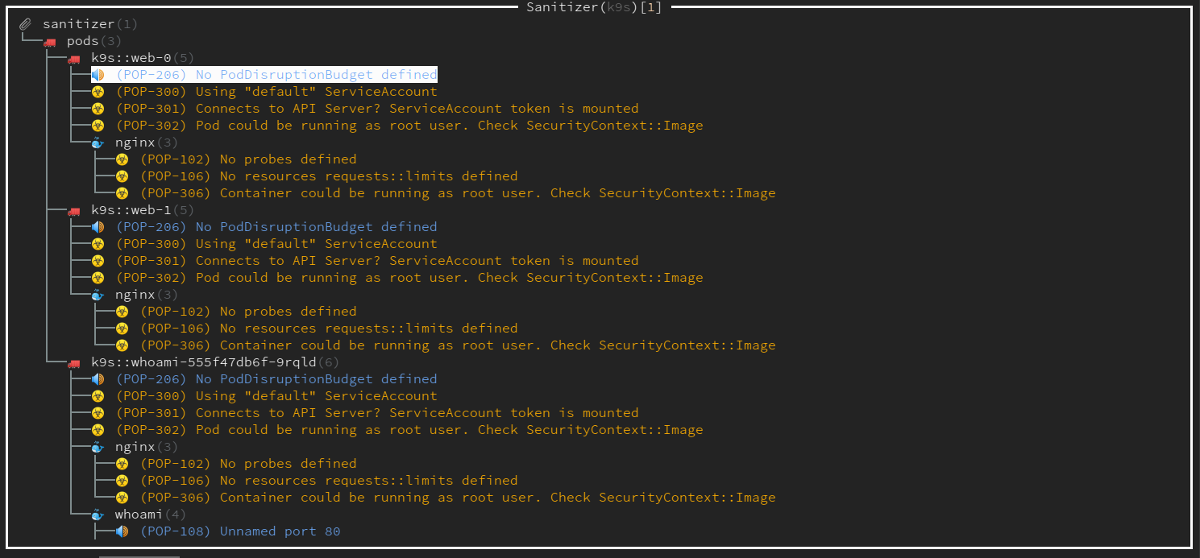
Popeye is another interesting feature of K9s. It checks all resources for conformity with the correctness criteria and displays the resulting “rating” with explanations. For example, with it, you can find out that some probes or resource limits are missing, or some container is running as root user…
Also, K9s provides basic Helm support. For example, this is how you can browse releases deployed to a cluster:
:helm all # all releases
:helm $namespace # releases in a specific namespace
Benchmark
K9s even boasts embedded hey — a basic HTTP load generator (it is a good alternative to the better-known ab, ApacheBench).
To enable it, you have to configure port forwarding in the pod. Select the pod and press SHIFT + f, go to the port-forward menu (using the “pf” alias).
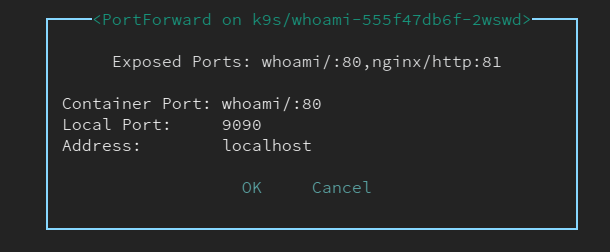
After selecting the port and hitting CTRL + b, the benchmark would start. Its results are saved in /tmp for subsequent analysis.

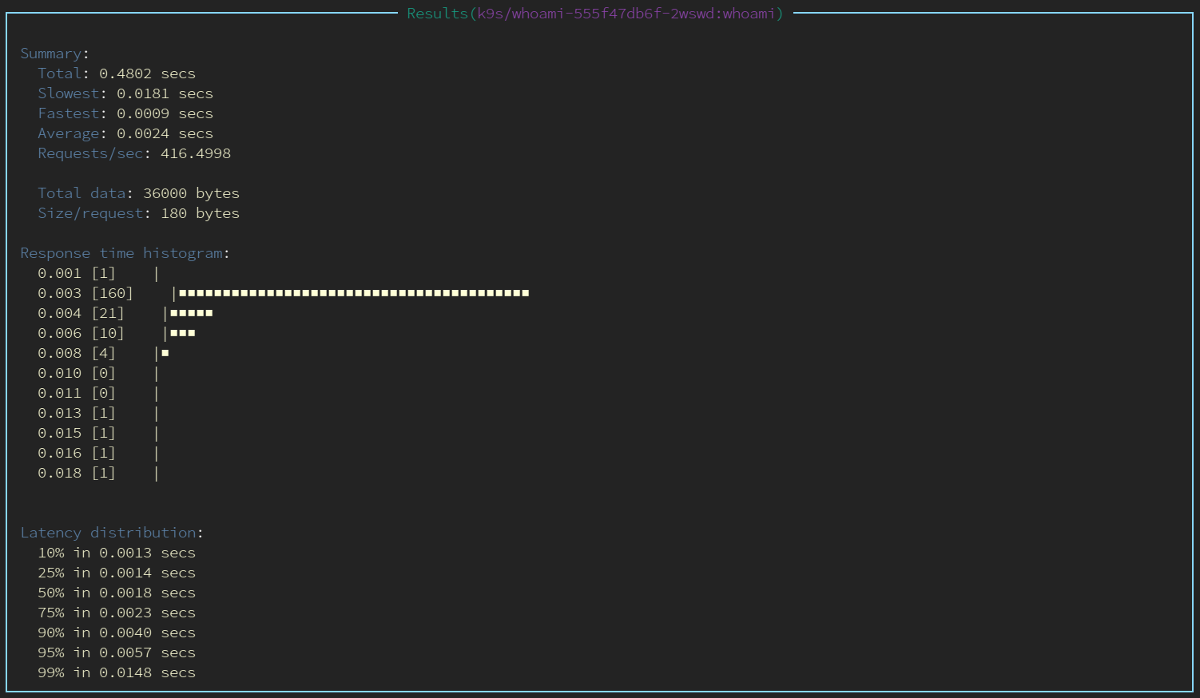
To change the configuration of the benchmark, create the $HOME/.k9s/bench-<my_context>.yml file (unique for each cluster).
NB: Note that all YAML files in the .k9s directory must have the .yml extension (.yaml doesn’t work for some reason).
Here is an example of the configuration:
benchmarks:
  defaults:
    # Number of threads
    concurrency: 2
    # Number of requests
   quests: 1000
  containers:
    # Settings for the benchmark container
    # The container is specified as namespace/pod-name:container-name
    default/nginx:nginx:
      concurrency: 2
     quests: 10000
      http:
        path: /
        method: POST
        body:
          {"foo":"bar"}
        header:
          Accept:
            - text/html
          Content-Type:
            - application/json
 services:
    # You can benchmark NodePort and LoadBalancer services
    # Syntax: namespace/service-name
    default/nginx:
      concurrency: 5
     quests: 500
      http:
        method: GET
        path: /auth
      auth:
        user: myuser
        password: s3cr3tp455w0rd
Interface
You can customize the column view for resource lists by modifying the $HOME/.k9s/views.yml file. Here is an example of its contents:
k9s:
 views:
   v1/pods:
     columns:
       - AGE
       - NAMESPACE
       - NAME
       - IP
       - NODE
       - STATUS
       -ADY
   v1/services:
     columns:
       - AGE
       - NAMESPACE
       - NAME
       - TYPE
       - CLUSTER-IP
Unfortunately, K9s lacks label-based columns (but there is a related issue in the project).
Use the following shortcuts to sort by columns:
Shift + n— by name;Shift + o— by node;Shift + i— by IP address;Shift + a— by container age;Shift + t— by number of restarts;Shift + r— by pod readiness;Shift + c— by CPU consumption;Shift + m— by memory consumption.
K9s supports skins, so you can customize the color scheme to your liking. Several ready-made skins are available in the K9spo. Here is an example of one of these skins called “in the navy”:

Plugins
Finally, there are plugins that allow you to extend K9s functionality. Personally, I have got the chance to use only one of them — kubectl get all -n $namespace.
Here is how everything works. First, create the $HOME/.k9s/plugin.yml file with the following contents:
plugin:
 get-all:
   shortCut: g
   confirm: false
   description: get all
   scopes:
   - all
   command: sh
   background: false
   args:
   - -c
   - "kubectl -n $NAMESPACE get all -o wide | less"
Now you can go to the target namespace and hit “g” to run the command defined above:

Take a look at the existing K9s community plugins. For example, there are plugins to make use of kubectl-jq and to leverage stern to output logs.
Conclusion
I’ve found K9s to be very convenient to work with: with it, you can conveniently search for everything you need without invoking kubectl. I like its log browsing and saving functionality, easy editing of resources, overall performance*; the Popeye mode has also proven useful. Also, I would like to highlight support for custom plugins and the ability to expand the application to suit your needs.
* Unfortunately, K9s slows down considerably when processing large log amounts. At such moments, K9s wholly used two cores of my Intel Xeon E312xx CPU and could even freeze.
As for possible improvements, I’d say this tool lacks the easy rollback to the previous version (I do not mean RSs) without switching to the directory. Plus, the rollback is available for the entire resource only: even if you have deleted only an annotation or a label, you will have to delete and restore the whole resource (that’s when you have to change to the appropriate directory). The lack of date of the creation of those backups is another small nuisance.



Comments