

Having the basics of Prometheus architecture and its storage covered in Part One of the series, we continue investigating its storage-related challenges and existing solutions. We will start with the story of a fictional startup engaged in developing software, collecting metrics from it, and struggling to find the best ways to store and process them. We will observe how it grows and how its monitoring system will evolve to meet the growing business requirements.
Stage 1: “Do we ever need monitoring?”
There is a little startup that doesn’t have any clients yet. However, they have a clever idea, so now they are looking for investors, first customers, and so on.
There are only three people working at the company: two developers and John, the CTO.
John’s main job is to look for investors. He meets with all kinds of people, presents the idea, and introduces the project to them. One day, the presentation goes awry: the app starts to lag and even crashes once. After the presentation, John asked the developers what that was all about.
One of the developers, Peter, replied that he had no idea what happened since they had no monitoring system. Thus, the company’s first objective was born: collecting metrics.
Choosing Prometheus seemed natural, and the relevant implementation was pretty straightforward. Prometheus collects the data, and Grafana visualizes it.

John goes on and asks, “What would happen if Prometheus crashed?” The answer is clear: no Prometheus, no data. Since the pull model is being used, if Prometheus is not running, there is nothing to collect metrics. The downsides of such an architecture are:
- the lack of fault tolerance;
- not scalable design due to Prometheus being heavily constrained by the resources available in the machine.
However, it’s not a big issue for this promising startup right now. So let’s just keep witnessing the story.
Stage 2: “Our monitoring should be always available!”
Time flies — the company has grown bigger, and it’s now over a year old. It boasts customers, investors, and a sizable community. The company’s headcount has also grown, as well as its infrastructure.
One late Friday night — sounds all too familiar, doesn’t it? — John receives a complaint from a customer.
He calls Peter and asks him to check out what might be going wrong. The priority level is high as the problem is affecting the customers. Peter replies that they only have one Prometheus instance, but its virtual machine is down now, so the monitoring system is not available at the moment, meaning Peter doesn’t actually know what’s going on with the application.
Here comes the next objective for the company: to make its monitoring fault-tolerant. How do you achieve that? The answer seems obvious: run a second Prometheus instance!
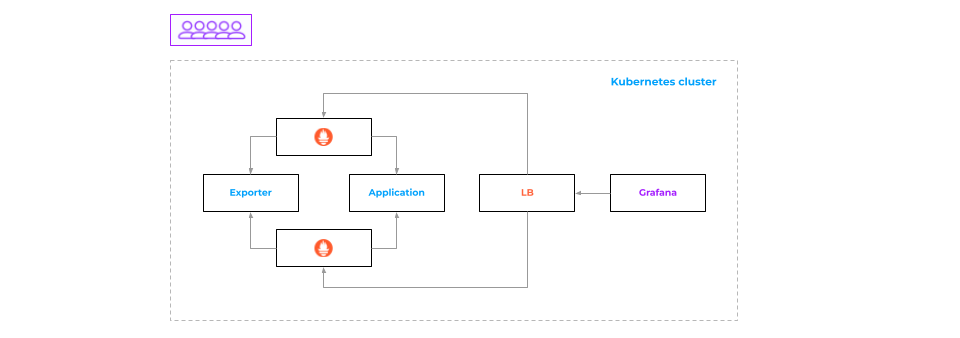
Running two Prometheus instances
Since it uses a pull model, you can simply copy the configuration files between the two, and both start collecting data from the same sources. Let’s take a closer look at how this works.
There are two Prometheus instances and a Load Balancer that routes traffic between them.
If the request ends up on the first Prometheus instance, that’s the instance the data is served from, and vice versa.
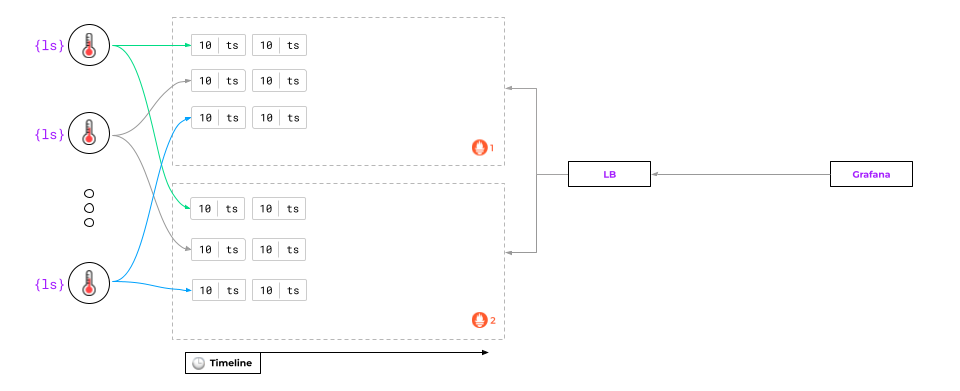
But what will happen if one of the Prometheus instances crashes?
At first glance, everything should be fine:
- The load balancer will take the crashed instance out of load balancing and stop receiving any requests.
- The second one will continue to collect metrics and render graphs.
It’s all good, however, until… the first instance restarts! That’s when the trouble begins — mainly due to the pull model — since some of the data will be lost.
Any attempt to request data from Prometheus, which has been temporarily down, will result in a gap in the graph:
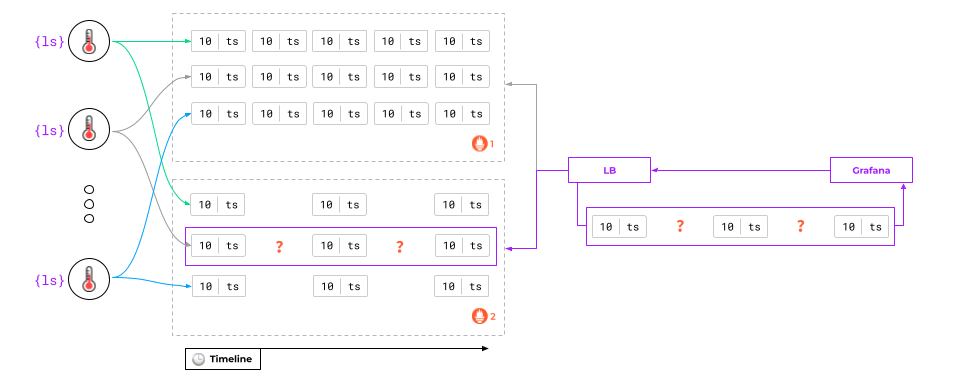
What can be done about it?
The first and easiest way is to create two data sources in Grafana and switch between them if there are gaps in the graphs. In this case, Grafana would retrieve data from the running Prometheus instance and draw it safely.
Unfortunately, the problem extends beyond that.
The thing is that one Prometheus instance may have one piece of data, while the other may have another piece of data. Whichever instance Grafana uses, there will still be gaps in the graphs!
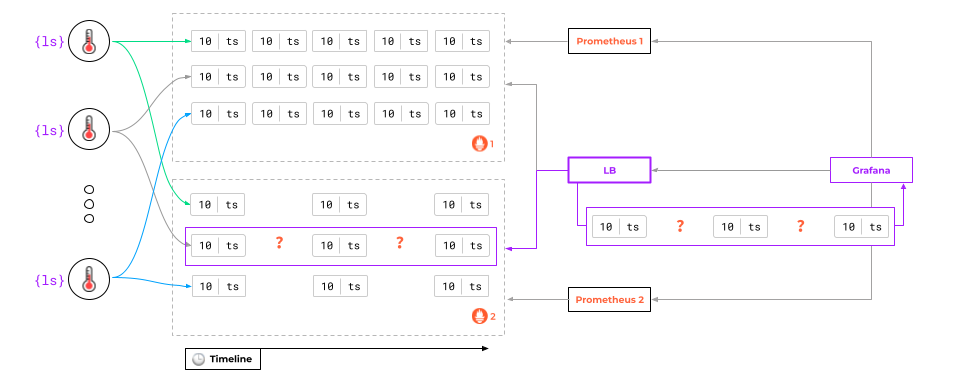
To be fair, such an architecture with two data sources is adequate in most cases. But if that’s not enough, there’s a solution: to set up a proxy in front of Prometheus.
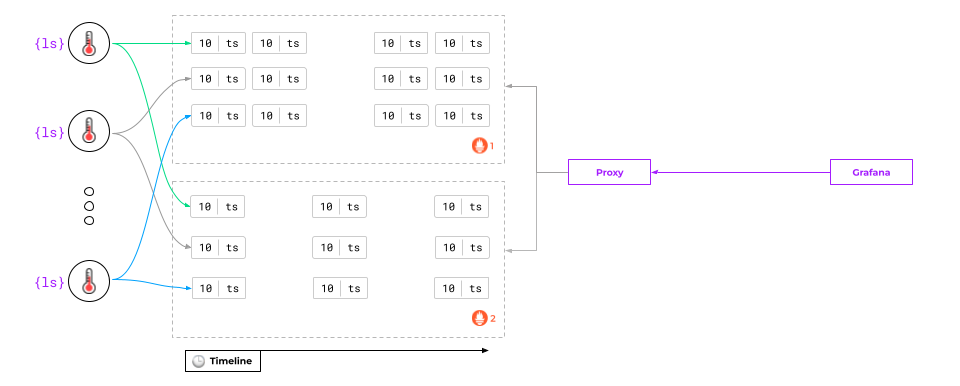
Adding a proxy
It has to be a specialized proxy for Prometheus rather than some common proxy like NGINX.
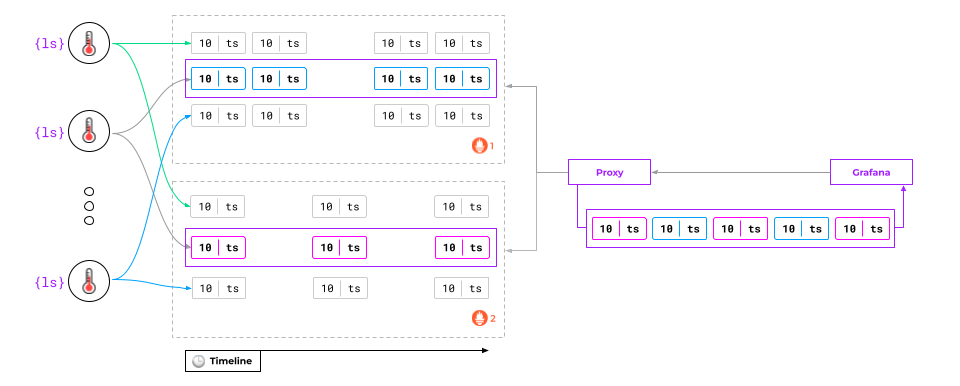
This proxy, upon receiving a request, will:
- retrieve data from all the Prometheus instances,
- merge them,
- execute a PromQL query on them,
- return the result.
What are the downsides to such a solution? Prometheus developers do not provide any tools to implement such proxies. There are only third-party developments, which creates an additional dependency since their PromQL version must match the Prometheus version. That’s not always feasible.
We’ve tested various tools. There are some worthy ones, but we don’t use them in production, so I can’t recommend any particular one.
There’s also another catch to Prometheus. It was not originally designed as a long-term data storage system, and the documentation clearly states that:
Again, Prometheus’s local storage is not intended to be durable long-term storage; external solutions offer extended retention and data durability.
That is, it can store data, say, for two or four weeks. But it cannot store it for, say, five years. That would definitely affect our startup… just a bit later.
Stage 3: “We need a centralized metrics storage!”
The startup has now grown into a large corporation. The number of employees has risen as well. Now there is even full-fledged customer care staff on board. The infrastructure has grown more complex, so there is an operation team as well as several development teams.
Initially, there was just a single Kubernetes cluster for the application, which was handling the load quite well. Now there are more clusters, and they are spread across multiple data centers, but the aforementioned monitoring system implementation still works.
One day, John gets a notification that some of the services are down. Being a good CTO, John starts to investigate.
The operations team says they have 10 data centers and are bouncing back and forth between different Grafanas trying to figure out what’s going on… Well, it turns out that the current implementation involving local Prometheus instances doesn’t work if there are a lot of clusters located in different places.
One option is to deploy a single shared Grafana that will collect data from all the data centers at once, but that still won’t be much help since you won’t see the bigger picture.
The only feasible solution is to collect metrics from different sources in a single place.
Solutions such as Thanos, Cortex, or Mimir will do the trick. They are different but share roughly the same basic idea: there is a “box” into which you can feed data from Prometheus instances and connect Grafana to it.
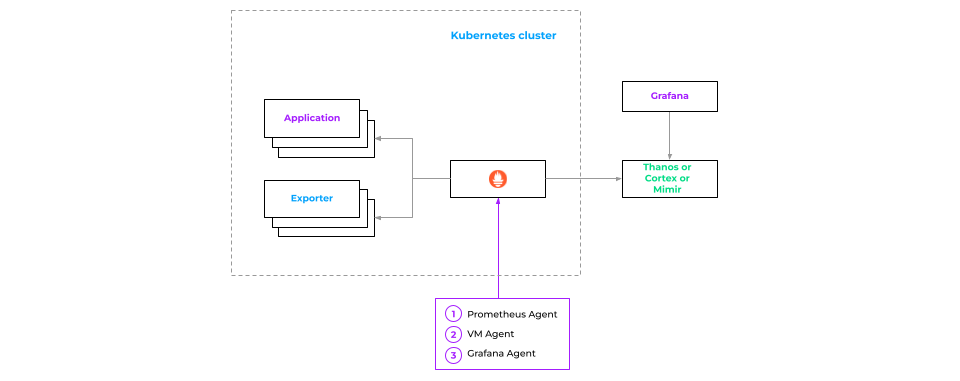
That begs a logical question: Is it now possible to do away with local Prometheus instances running in a cluster to save money?
Well, it depends. You can replace Prometheus with a bunch of more lightweight apps like Prometheus Agent, VM Agent, Grafana Agent, or OpenTelemetry Collector. Those can collect metrics and push them to the external repository.
However, there are some minor details to be accounted for:
- Since there is no longer any entity responding to queries, your autoscaling (HPA and VPA in Kubernetes) won’t work in the cluster.
- Your pre-calculated metrics might become wrong because there is nothing to calculate them with.
- Your alerting system might suffer, too. If the connection between our Prometheus and the centralized storage is broken, the most we will get is a connection failure notification (without any details on the incident).
As an option, you can use Prometheus with retention for 1 day. This will reduce the size: Prometheus won’t eat up as many resources, and all three issues mentioned above won’t be a problem for us.
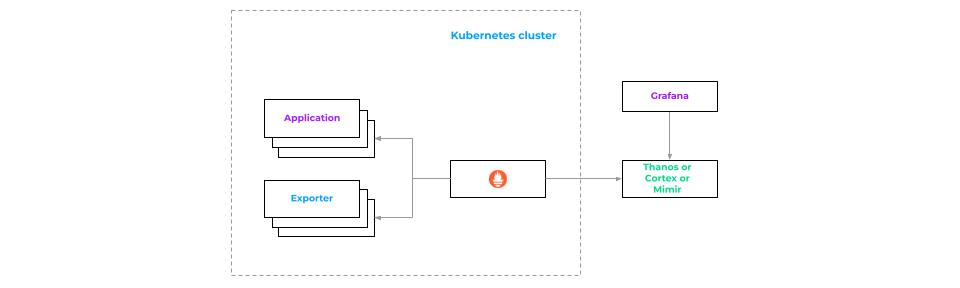
Thus, we end up with the following architecture:
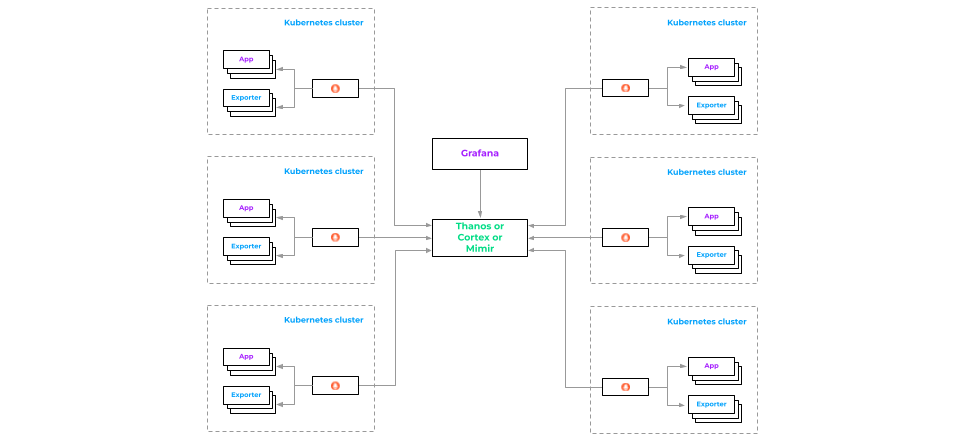
There are a number of clusters that write metrics to a centralized metrics store, and there is Grafana which allows you to view all the metrics. It’s time to leave our startup for the best and focus on the challenges of long-term storage for monitoring metrics.
What is centralized metrics storage?
Note: While there are different solutions to implement your centralized metrics storage, such as mentioned above, we will use Mimir as our example. It is based on our practical experience of using it intensively, and it should still be helpful even for those who consider other similar solutions.
The main issue with Prometheus is its monolithic nature. To get rid of it, Mimir developers thought of a simple trick: they took Prometheus and split it into microservices! That is, they “cut” it into pieces and ended up with Mimir, a microservice version of Prometheus.
They also added data separation between different tenants, allowing data from different clusters or data centers to be stored independently of each other. But you can still do multi-tenant queries.
How does Mimir work?
The centralized storage architecture implemented in Mimir is as follows:
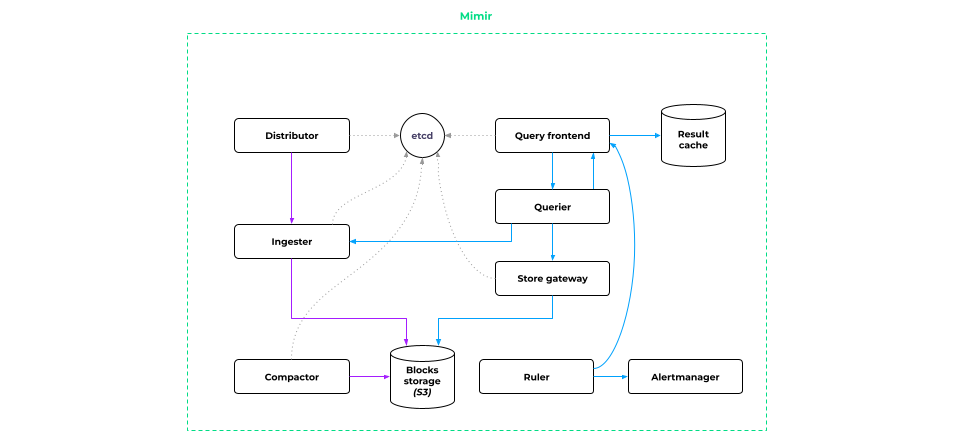
At first glance, it seems complicated, but let’s explore it piece by piece.
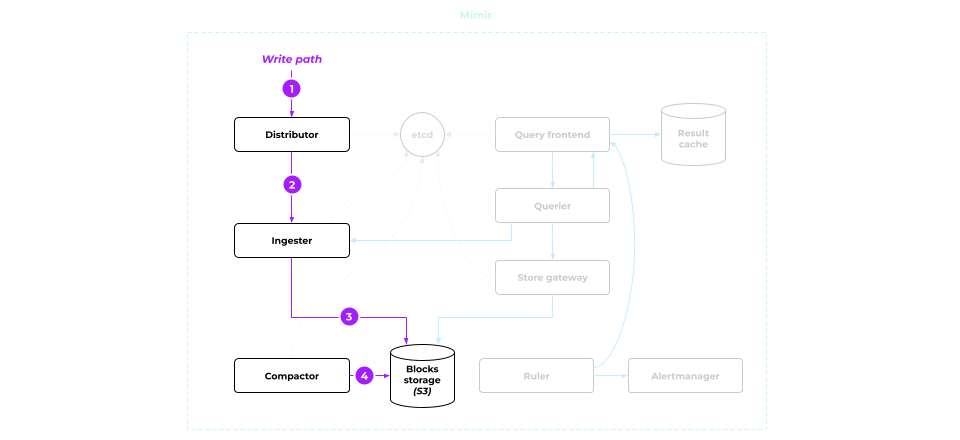
Writing metrics
- All metrics are initially fed into the Distributor. Its main job is to confirm that the metrics are in proper format and to select the Ingester to forward them to.
- The data is then submitted to the Ingester. It generates data blocks in its memory (the same blocks we discussed earlier — effectively, the Prometheus blocks).
- Once a block is full, Mimir finalizes it, saves it to disk, and sends it to S3 for long-term storage.
- Once the metrics are written to S3, Compactor comes into play to optimize the block storage. It merges one-hour blocks into two-hour blocks, and so on. (Please refer to Part One of this article to learn more about the corresponding algorithm.)
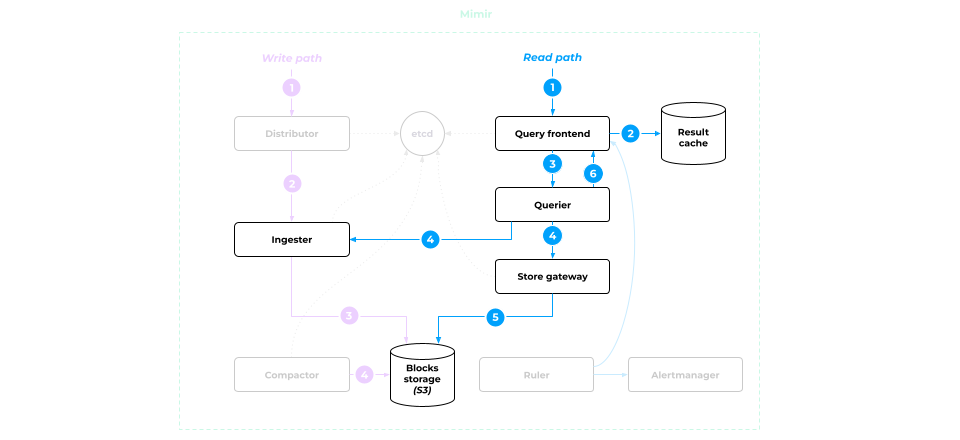
Reading metrics
This is where things get a little more complicated.
All the queries end up in the Query frontend. It:
- checks the cache for a ready-made response to the query received and returns it if the data is found;
- if no data is found, the query is forwarded to Querier.
Querier retrieves the query from the Query frontend and prepares the data required to execute that query. To do so, it requests them first from Ingester and then from the Store gateway, which acts as the S3 data gateway.
What is the Store gateway for, and why not fetch metrics right from S3? Let’s look at it in a little bit closer detail.
Store gateway
The data blocks are stored in S3. When launched, the Store gateway downloads the parts of blocks with IDs that match the label sets. This is typically 5–10% of the total data volume.
When a data request comes in:
- Store gateway accesses the local label and ID match data to figure out which data should be retrieved from which S3 blocks.
- Next, it pulls the required metrics and submits them to Querier.
- The data reaches the Query frontend, which performs PromQL calculations and serves the results to the user.
Mimir architecture benefits
Why is this architecture so complex? There are several reasons:
- Resiliency: All Mimir components scale independently of each other. This ensures fault tolerance and allows the system to adapt to different load profiles.
- All components to which data is written to or read from support replication. For example, the Distributor sends data to multiple Ingesters rather than just to one. This allows for smooth updates and renders the system invulnerable to failures within the individual virtual machines it is running on.
- Scaling: All components support data sharding, with each component containing only a portion of the data rather than the entire data set.
- Storage space optimization — thanks to Compactor.
Mimir’s pros and cons
In summary, the overall pros of Mimir are the following:
- Fault-tolerance out of the box.
- Horizontal scaling (with data sharding capability).
- Huge (decades-long!) monitoring data storage.
- Splitting of monitoring data.
The cons of Mimir are:
- Complexity.
- Need for extra expertise.
There are also pending issues which you should consider while thinking about Mimir as your centralized metrics storage:
- It lacks authorization mechanisms.
- Its resource consumption is high.
- Its speed depends on the network’s performance.
Comparison of Prometheus storage options
The table below concludes our narrative. It shows the pros & cons of various Prometheus setups with respect to collecting monitoring metrics and storing them.
| Collecting metrics | High availability | Long-term storage | Centralized storage | Learning curve | |
| Prometheus | ✅ | ❌ | ❌ | ❌ | 🟢 |
| Prometheus HA | ✅ | ✅ | ❌ | ❌ | 🟡 |
| Prometheus long-term | ✅ | ❌ | ✅ | ❌ | 🟡 |
| Prometheus long-term + HA | ✅ | ✅ | ✅ | ❌ | 🟡 |
| Mimir | ❌ | ✅ | ✅ | ✅ | 🔴 |
This comparison table, combined with our story about a fictional startup and its gradual growth, should help you realize why and when you need storage solutions such as Mimir in your observability stack. Again, while Mimir is our (battle-tested) example for this article, feel free to consider other options to get your long-term centralized storage for metrics.
Do you already have some experience — and challenges — with such tools? Share it in the comments below — we’ll be happy to know and discuss it!

Comments