

In an earlier article, we talked about KeyDB — a fork of Redis in development since 2019, which became a part of Snap last year. It is Open Source (using a BSD license), boasts over 6k stars on GitHub and can be used as a drop-in replacement for Redis. How did it appear? Its authors were experiencing performance issues with the parent project. One day, they opted for a hardcore approach to deal with them: they took development into their own hands. Over the years, they’ve added many new features in multithreading and other areas.
In this article, we share our new positive experience swapping Redis for KeyDB. However, please, note while KeyDB proves to be a viable Redis alternative, it’s not a one-size-fits-all approach — mind the peculiar properties of this specific migration.
The backstory
One of our client applications was using Redis, which turned out to be quite loaded. At first, we used spotahome/redis-operator to implement Redis Failover in master/slave mode. But as the project grew, the gigabit network on the master Redis node became a major bottleneck. Regardless of the number of replicas, the master was the only node handling the entire load, while all the replicas played a purely secondary role.
Then, we decided to switch to a Redis cluster. In it, the keys are sharded between several masters, with each master having its own replicas. Distributing data across multiple shards eliminated the network bottleneck, as the load also became distributed between them.
At that time, we thought the resource issue had lost relevance for the foreseeable future (we had been using this approach for about a year). Sadly, we turned out to be wrong.
Redis single-threadedness strikes back
Migrating the service from one data centre to another resulted in the PHP application suddenly slowing down. Redis was one of the probable culprits, although, at first glance, its response time appeared to be fine.
To confirm this, we created a simple test that emulated the way a PHP application works with Redis:
<?php
$start=microtime(true);
$redis = new RedisCluster(NULL, Array('redis-cluster:6379'));
$key='test'.rand(0,10000);
$redis->set($key,'test_data',10);
$redis->get($key);
echo (microtime(true)-$start)."\n";
The test results were surprising — sometimes Redis did respond slowly:
0.003787
0.144506
0.007667
0.005908
0.00354
0.003886
0.006331
0.193661
0.222443
0.00558
0.0029
Upon taking a closer look, we found that the master of one of the shards consumed almost 100% of the resources of a single core. It was then that we realized that Redis is single-threaded, meaning the processing power of a single core imposed a ceiling on the number of requests being processed.
The new data centre we moved to had more powerful hardware (as a whole). However, the per-core performance of the new processors turned out to be lower than the old ones. The physical Intel(R) Xeon(R) CPUs @ 3.40GHz in the old cluster were replaced with “vSphered” Intel(R) Xeon(R) Gold 6132 CPUs @ 2.60GHz in the new cluster. This contributed to latencies when accessing some Redis keys and diminished the overall application performance.
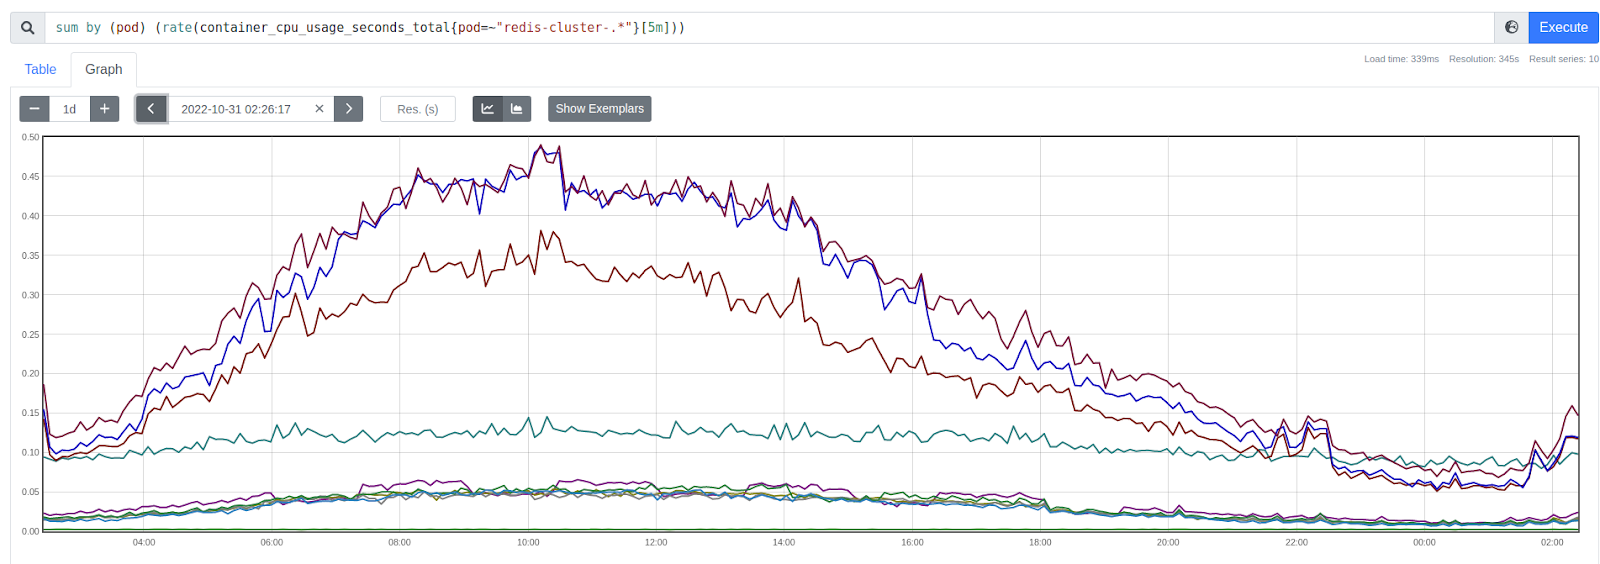
Here is the CPU usage chart for the old cluster (the y-axis shows the number of CPU cores used by the process):
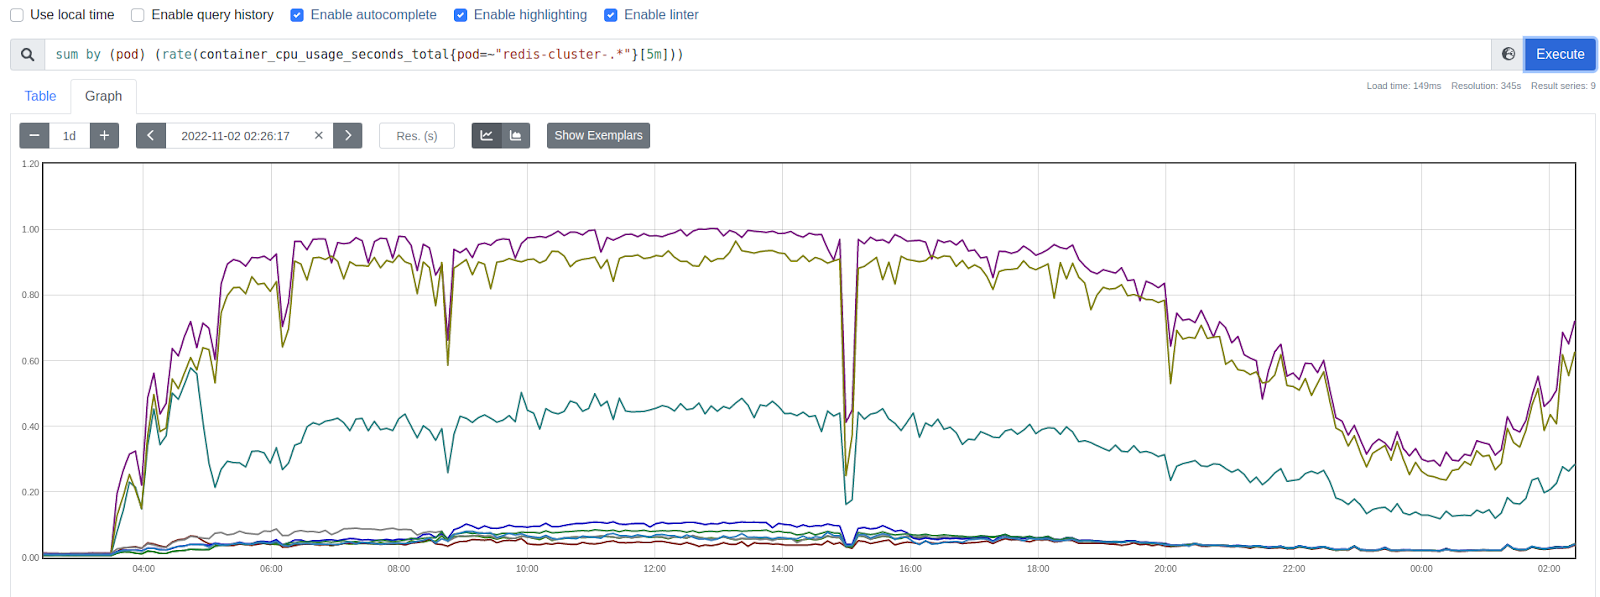
And here is the same chart for the new cluster:
The solution
So we had to think hard about what our options were. Re-sharding Redis right away was not an option, given its large size and the fact that the application was under a heavy load, so we decided to swap it for KeyDB — an alternative with which we already had some experience before.
Since we deployed Redis in Kubernetes, the idea was to replace the redis image in the relevant container with the keydb image. It should have worked since the developers claim that KeyDB supports the Redis data structure “out of the box” — with no changes required.
First, we tried our setup in a test environment by populating the Redis cluster with a hundred random keys, replacing the image in the container with the eqalpha/keydb image, and changing the startup command from redis-server -c /etc/redis.conf to keydb-server -c /etc/redis.conf --server-threads 4. Then we restarted all Pods one at a time (the cluster was running as a StatefulSet using the OnDelete updateStrategy).
All the containers were restarted. Then they joined the cluster and underwent synchronization. The investigation showed the data was in place: all the test keys we populated the Redis cluster with were successfully retrieved from the KeyDB cluster.
Production migration
Since the test was successful, we decided to do the same trick with the production cluster. We changed the image in the configuration, waited until all the Pods were updated, and started to monitor the response time from the shards — it was the same for all of them.
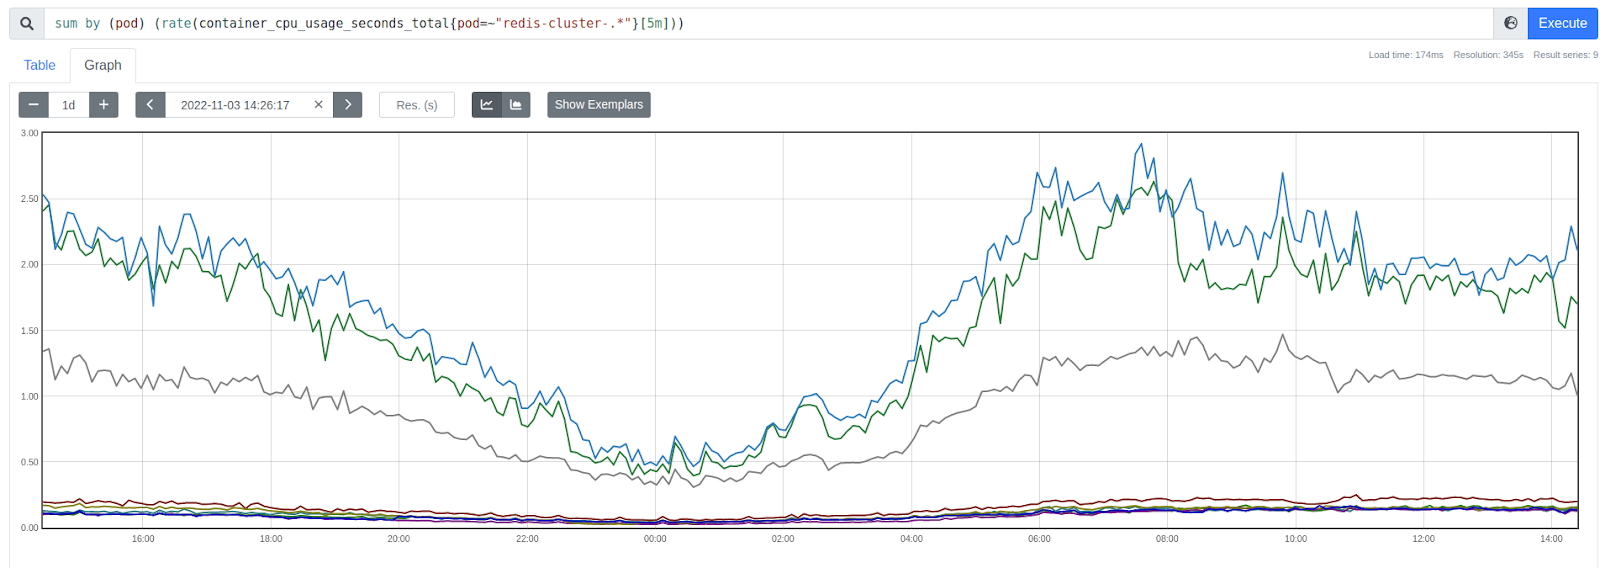
The chart shows that new Redis instances consume more than one core:
Latency monitoring
To add essential observability on top of this solution, we created a little Go application so that we can monitor the Redis cluster response time. It boils down to the following implementation:
- Every second, it populates the cluster with a randomly named key (you can configure a prefix for the key name) and a TTL of 2 seconds.
- The random name allows keys to be scattered across different shards in the cluster, making the result more closely resemble the way a real-life application works.
- The time spent on connecting and writing was saved, and the 60 most recent readings were stored in the memory.
- If writing fails, the failed attempts counter is incremented. Failed attempts are not included in the average response time calculation.
The application exports metrics in the Prometheus format: maximum/minimum/average operation time for the last 60 seconds and the number of errors:
# HELP redis_request_fail Counter redis key set fails
# TYPE redis_request_fail counter
redis_request_fail{redis="redis-cluster:6379"} 0
# HELP redis_request_time_avg Gauge redis average request time for last 60 sec
# TYPE redis_request_time_avg gauge
redis_request_time_avg{redis="redis-cluster.:6379"} 0.018229623
# HELP redis_request_time_max Gauge redis max request time for last 60 sec
# TYPE redis_request_time_max gauge
redis_request_time_max{redis="redis-cluster:6379"} 0.039543021
# HELP redis_request_time_min Gauge redis min request time for last 60 sec
# TYPE redis_request_time_min gauge
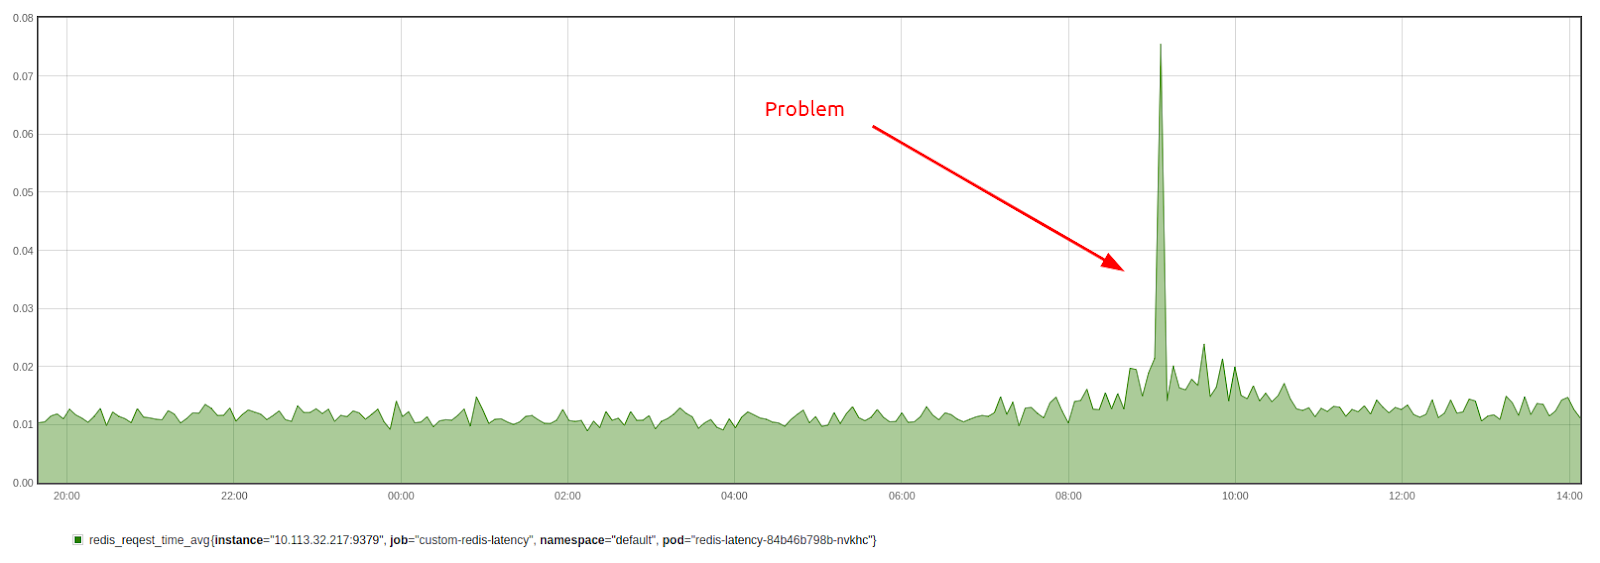
redis_request_time_min{redis="redis-cluster:6379"} 0.006561593Here’s a chart showing the results:
Running a testing application on several or all cluster nodes allows you to see whether the latency differs from node to node. For example, a high latency may indicate network congestion on a node.
Here is the backbone of this monitoring app:
package main

import (
	"context"
	"flag"
	"fmt"
	"math/rand"
	"net/http"
	"time"

	"github.com/go-redis/redis/v8"
	"github.com/prometheus/client_golang/prometheus"
	"github.com/prometheus/client_golang/prometheus/promhttp"
)

var ctx = context.Background()
var results [60]float64

var (
	avgReqTime = prometheus.NewGaugeVec(
		prometheus.GaugeOpts{
			Name: "redis_request_time_avg",
			Help: "Gauge redis average request time for last 60 sec",
		},
		[]string{"redis"},
	)
	maxReqTime = prometheus.NewGaugeVec(prometheus.GaugeOpts{
		Name: "redis_request_time_max",
		Help: "Gauge redis max request time for last 60 sec",
	},
		[]string{"redis"},
	)
	minReqTime = prometheus.NewGaugeVec(prometheus.GaugeOpts{
		Name: "redis_request_time_min",
		Help: "Gauge redis min request time for last 60 sec",
	},
		[]string{"redis"},
	)
	failedReq = prometheus.NewCounterVec(prometheus.CounterOpts{
		Name: "redis_request_fail",
		Help: "Counter redis key set fails",
	},
		[]string{"redis"},
	)
	RedisAddress = flag.String("redis", "127.0.0.1:6379", "redis cluster addresses")
	RedisKey     = flag.String("key", "test", "test-key name prefix")
)

func findValues(a [60]float64) (min float64, max float64, avg float64) {
	min = 60
	max = 0
	var sum float64 = 0
	var count int = 0

	for _, value := range a {
		if value >= 0 {
			count++
			sum += value
		}
		if value < min && value > 0 {
			min = value
		}
		if value > max {
			max = value
		}
	}
	if count > 0 {
		return min, max, sum / float64(count)
	} else {
		return 60, 60, 60
	}

}

func collect(redis_address string, key string) {
	var i = 0
	for i := 0; i < 60; i++ {
		results[i] = -1
	}
	for {
		i = i % 60
		key := fmt.Sprintf("%s_%d", key, rand.Int())
		start := time.Now()
		rdb := redis.NewClusterClient(&redis.ClusterOptions{
			Addrs:        []string{redis_address},
			DialTimeout:  1000 * time.Millisecond,
			ReadTimeout:  1000 * time.Millisecond,
			WriteTimeout: 1000 * time.Millisecond,
		})
		err := rdb.SetNX(ctx, key, "ping", 2*time.Second).Err()
		duration := time.Since(start)

		if err != nil {
			results[i] = -1
			failedReq.With(prometheus.Labels{"redis": string(redis_address)}).Inc()
		} else {
			results[i] = duration.Seconds()
		}
		rdb.Close()
		if duration.Milliseconds() < 1000 {
			time.Sleep(time.Duration(1000-duration.Milliseconds()) * time.Millisecond)
		}
		min, max, avg := findValues(results)
		avgReqTime.With(prometheus.Labels{"redis": string(redis_address)}).Set(avg)
		maxReqTime.With(prometheus.Labels{"redis": string(redis_address)}).Set(max)
		minReqTime.With(prometheus.Labels{"redis": string(redis_address)}).Set(min)
		fmt.Printf("Max: %0.4f Min: %0.4f Avg: %0.4f Lst: %0.4f\n", max, min, avg, results[i])
		i++
	}
}

func main() {
	flag.Parse()
	prometheus.MustRegister(avgReqTime)
	prometheus.MustRegister(minReqTime)
	prometheus.MustRegister(maxReqTime)
	prometheus.MustRegister(failedReq)
	failedReq.With(prometheus.Labels{"redis": string(*RedisAddress)}).Add(0)
	go collect(*RedisAddress, *RedisKey)
	http.Handle("/metrics", promhttp.Handler())
	http.ListenAndServe(":9379", nil)
}
You can also use a pre-built Docker image.
It is worth noting that Redis provides latency metrics (you can enable them using the following command):
CONFIG SET latency-monitor-threshold 100It sets a limit in milliseconds to log the commands and activity of the Redis instance above the limit. However, this is the Redis side of the metric; meanwhile, we need to see the application side as well.
Multithreading in Redis
Redis 6 has multithreading implemented. However, as the description hints, it isn’t as effective as the one in KeyDB. The io-threads 4 server parameter activates this mode. Using it, different threads receive requests, parse/process data, and send responses. It can be useful if keys are huge: in single-threaded mode, Redis will not accept/process new requests until a response to the preceding request is sent.
A detailed comparison of Redis and KeyDB performance in multi-threaded mode can be found in the official KeyDB documentation. The results indicate that KeyDB shows significant performance gains over Redis as more cores become available. Even with multi-threaded I/O enabled, Redis 6 still lags behind KeyDB in light of its inferior vertical scaling capabilities. This benchmark was performed by an interested party, though, so it might be a good idea to run your own tests before making a strong decision.
Summary
This case proves that one could scale Redis vertically by replacing it with KeyDB. At least, it is reasonable when you are limited by the per-core performance of your CPU and don’t feel excited about sharding your Redis to make different instances utilize different cores. This method seems good enough since KeyDB is not just an alternative, but an actual fork of Redis and thus should pick up Redis data without any issues.
On top of that, this situation analysis has allowed us to create a handy exporter and configure alerts based on its metrics. Now we can troubleshoot problems more efficiently or even avoid them altogether.
Finally, as we stated above, opting for KeyDB is not a silver bullet; you need to take into account the nature of your case. Depending on it, you might also consider other solutions, such as Dragonfly — another in-memory datastore that is fully compatible with Redis. (However, while Dragonfly source code is available, this project is not Open Source but uses the Business Source License.)
* Redis is a registered trademark of Redis Ltd. Any rights therein are reserved to Redis Ltd. Any use by Palark GmbH is for referential purposes only and does not indicate any sponsorship, endorsement or affiliation between Redis and Palark GmbH.

Comments